Chrysler 2010 Annual Report Download - page 71
Download and view the complete annual report
Please find page 71 of the 2010 Chrysler annual report below. You can navigate through the pages in the report by either clicking on the pages listed below, or by using the keyword search tool below to find specific information within the annual report.-
 1
1 -
2
-
3
-
4
-
5
-
6
-
7
-
8
-
9
-
10
-
11
-
12
-
13
-
14
-
15
-
16
-
17
-
18
-
19
-
20
-
21
-
22
-
23
-
24
-
25
-
26
-
27
-
28
-
29
-
30
-
31
-
32
-
33
-
34
-
35
-
36
-
37
-
38
-
39
-
40
-
41
-
42
-
43
-
44
-
45
-
46
-
47
-
48
-
49
-
50
-
51
-
52
-
53
-
54
-
55
-
56
-
57
-
58
-
59
-
60
-
 61
61 -
 62
62 -
 63
63 -
 64
64 -
 65
65 -
 66
66 -
 67
67 -
 68
68 -
 69
69 -
 70
70 -
 71
71 -
 72
72 -
 73
73 -
 74
74 -
 75
75 -
 76
76 -
 77
77 -
 78
78 -
 79
79 -
 80
80 -
 81
81 -
82
-
83
-
84
-
85
-
86
-
87
-
88
-
89
-
90
-
91
-
92
-
93
-
94
-
95
-
96
-
97
-
98
-
99
-
100
-
101
-
102
-
103
-
104
-
105
-
106
-
107
-
108
-
109
-
110
-
111
-
112
-
113
-
114
-
115
-
116
-
117
-
118
-
119
-
120
-
121
-
122
-
123
-
124
-
125
-
126
-
127
-
128
-
129
-
130
-
131
-
132
-
133
-
134
-
135
-
136
-
137
-
138
-
139
-
140
-
141
-
142
-
143
-
144
-
145
-
146
-
147
-
148
-
149
-
150
-
151
-
152
-
153
-
154
-
155
-
156
-
157
-
158
-
159
-
160
-
161
-
162
-
163
-
164
-
165
-
166
-
167
-
168
-
169
-
170
-
171
-
172
-
173
-
174
-
175
-
176
-
177
-
178
-
179
-
180
-
181
-
182
-
183
-
184
-
185
-
186
-
187
-
188
-
189
-
190
-
191
-
192
-
193
-
194
-
195
-
196
-
197
-
198
-
199
-
200
-
201
-
202
-
203
-
204
-
205
-
206
-
207
-
208
-
209
-
210
-
211
-
212
-
213
-
214
-
215
-
216
-
217
-
218
-
219
-
220
-
221
-
222
-
223
-
224
-
225
-
226
-
227
-
228
-
229
-
230
-
231
-
232
-
233
-
234
-
235
-
236
-
237
-
238
-
239
-
240
-
241
-
242
-
243
-
244
-
245
-
246
-
247
-
248
-
249
-
250
-
251
-
252
-
253
-
254
-
255
-
256
-
257
-
258
-
259
-
260
-
261
-
262
-
263
-
264
-
265
-
266
-
267
-
268
-
269
-
270
-
271
-
272
-
273
-
274
-
275
-
276
-
277
-
278
-
279
-
280
-
281
-
282
-
283
-
284
-
285
-
286
-
287
-
288
-
289
-
290
-
291
-
292
-
293
-
294
-
295
-
296
-
297
-
298
-
299
-
300
-
301
-
302
-
303
-
304
-
305
-
306
-
307
-
308
-
309
-
310
-
311
-
312
-
313
-
314
-
315
-
316
-
317
-
318
-
319
-
320
-
321
-
322
-
323
-
324
-
325
-
326
-
327
-
328
-
329
-
330
-
331
-
332
-
333
-
334
-
335
-
336
-
337
-
338
-
339
-
340
-
341
-
342
-
343
-
344
-
345
-
346
-
347
-
348
-
349
-
350
-
351
-
352
-
353
-
354
-
355
-
356
-
357
-
358
-
359
-
360
-
361
-
362
-
363
-
364
-
365
-
366
-
367
-
368
-
369
-
370
-
371
-
372
-
373
-
374
-
375
-
376
-
377
-
378
-
379
-
380
-
381
-
382
-
383
-
384
-
385
-
386
-
387
-
388
-
389
-
390
-
391
-
392
-
393
-
394
-
395
-
396
-
397
-
398
-
399
-
400
-
401
-
402
 |
 |

REPORT ON
OPERATIONS
FINANCIAL
REVIEW –
FIAT GROUP
70
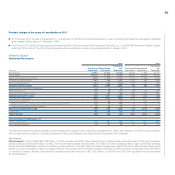
Fiat Group Automobiles recorded a €607 million trading profit for 2010 (trading margin of 2.2%), compared to the €470 million figure for 2009 (1.8%
margin). The improved trading performance was attributable to a better product/market mix, linked to the performance of light commercial vehicles and
the Brazilian business, in addition to continued improvements from World Class Manufacturing and purchasing efficiencies.
For 2010, Maserati had a trading profit of €24 million (trading margin: 4.1%). The sharp increase over the €11 million trading profit for 2009 (trading
margin: 2.5%) was attributable to both higher sales volumes and continued optimization of operating costs.
Ferrari closed 2010 with a trading profit of €303 million (trading margin: 15.8%), compared to €238 million for 2009 (trading margin: 13.4%). The increase
was attributable to higher sales volumes, excellent results from the customization program and efficiency gains.
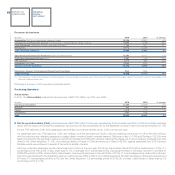
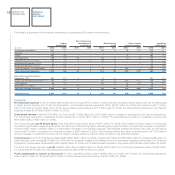
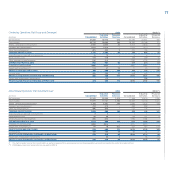
Components and Production Systems
In 2010, Components and Production Systems nearly tripled trading profit to €249 million (trading margin of 2.3%), up €160 million from 2009, driven primarily
by higher volumes and improved product mix.
(€ million) 2010 2009 Change
Fiat Powertrain 140 104 36
Components (Magneti Marelli) 98 25 73
Metallurgical Products (Teksid) 17 (12) 29
Production Systems (Comau) (6) (28) 22
Total 249 89 160
Trading margin (%) 2.3 1.0
Fiat Powertrain closed 2010 with a trading profit of €140 million, compared to €104 million for 2009. This improvement was primarily attributable to a more
favorable sales mix and increased purchasing and manufacturing efficiencies.
Magneti Marelli reported trading profit of €98 million for 2010 compared with €25 million for 2009. The improvement in trading performance was driven
by increased sales volumes, combined with cost containment actions and manufacturing efficiencies. However, the sector had to manage the unfavorable
impact of supply issues resulting from an excess in market demand for electronic systems.
Teksid closed the year with a trading profit of €17 million (trading loss of €12 million for 2009), reflecting the positive impact of volume increases.
Comau reduced its trading loss to €6 million for 2010, compared with a trading loss of €28 million for 2009. The improvement was attributable to the
increase in activity levels and cost containment actions.
Other Businesses
In 2010, Other Businesses reported a trading loss of €71 million, including eliminations and consolidation adjustments, compared to a €72 million loss
for 2009.