Chrysler 2010 Annual Report Download - page 349
Download and view the complete annual report
Please find page 349 of the 2010 Chrysler annual report below. You can navigate through the pages in the report by either clicking on the pages listed below, or by using the keyword search tool below to find specific information within the annual report.-
 1
1 -
2
-
3
-
4
-
5
-
6
-
7
-
8
-
9
-
10
-
11
-
12
-
13
-
14
-
15
-
16
-
17
-
18
-
19
-
20
-
21
-
22
-
23
-
24
-
25
-
26
-
27
-
28
-
29
-
30
-
31
-
32
-
33
-
34
-
35
-
36
-
37
-
38
-
39
-
40
-
41
-
42
-
43
-
44
-
45
-
46
-
47
-
48
-
49
-
50
-
51
-
52
-
53
-
54
-
55
-
56
-
57
-
58
-
59
-
60
-
61
-
62
-
63
-
64
-
65
-
66
-
67
-
68
-
69
-
70
-
71
-
72
-
73
-
74
-
75
-
76
-
77
-
78
-
79
-
80
-
81
-
82
-
83
-
84
-
85
-
86
-
87
-
88
-
89
-
90
-
91
-
92
-
93
-
94
-
95
-
96
-
97
-
98
-
99
-
100
-
101
-
102
-
103
-
104
-
105
-
106
-
107
-
108
-
109
-
110
-
111
-
112
-
113
-
114
-
115
-
116
-
117
-
118
-
119
-
120
-
121
-
122
-
123
-
124
-
125
-
126
-
127
-
128
-
129
-
130
-
131
-
132
-
133
-
134
-
135
-
136
-
137
-
138
-
139
-
140
-
141
-
142
-
143
-
144
-
145
-
146
-
147
-
148
-
149
-
150
-
151
-
152
-
153
-
154
-
155
-
156
-
157
-
158
-
159
-
160
-
161
-
162
-
163
-
164
-
165
-
166
-
167
-
168
-
169
-
170
-
171
-
172
-
173
-
174
-
175
-
176
-
177
-
178
-
179
-
180
-
181
-
182
-
183
-
184
-
185
-
186
-
187
-
188
-
189
-
190
-
191
-
192
-
193
-
194
-
195
-
196
-
197
-
198
-
199
-
200
-
201
-
202
-
203
-
204
-
205
-
206
-
207
-
208
-
209
-
210
-
211
-
212
-
213
-
214
-
215
-
216
-
217
-
218
-
219
-
220
-
221
-
222
-
223
-
224
-
225
-
226
-
227
-
228
-
229
-
230
-
231
-
232
-
233
-
234
-
235
-
236
-
237
-
238
-
239
-
240
-
241
-
242
-
243
-
244
-
245
-
246
-
247
-
248
-
249
-
250
-
251
-
252
-
253
-
254
-
255
-
256
-
257
-
258
-
259
-
260
-
261
-
262
-
263
-
264
-
265
-
266
-
267
-
268
-
269
-
270
-
271
-
272
-
273
-
274
-
275
-
276
-
277
-
278
-
279
-
280
-
281
-
282
-
283
-
284
-
285
-
286
-
287
-
288
-
289
-
290
-
291
-
292
-
293
-
294
-
295
-
296
-
297
-
298
-
299
-
300
-
301
-
302
-
303
-
304
-
305
-
306
-
307
-
308
-
309
-
310
-
311
-
312
-
313
-
314
-
315
-
316
-
317
-
318
-
319
-
320
-
321
-
322
-
323
-
324
-
325
-
326
-
327
-
328
-
329
-
330
-
331
-
332
-
333
-
334
-
335
-
336
-
337
-
338
-
 339
339 -
 340
340 -
 341
341 -
 342
342 -
 343
343 -
 344
344 -
 345
345 -
 346
346 -
 347
347 -
 348
348 -
 349
349 -
 350
350 -
 351
351 -
 352
352 -
 353
353 -
 354
354 -
 355
355 -
 356
356 -
 357
357 -
 358
358 -
 359
359 -
360
-
361
-
362
-
363
-
364
-
365
-
366
-
367
-
368
-
369
-
370
-
371
-
372
-
373
-
374
-
375
-
376
-
377
-
378
-
379
-
380
-
381
-
382
-
383
-
384
-
385
-
386
-
387
-
388
-
389
-
390
-
391
-
392
-
393
-
394
-
395
-
396
-
397
-
398
-
399
-
400
-
401
-
402
 |
 |

FIAT S.P.A.
STATUTORY
FINANCIAL
STATEMENTS AT
31 DECEMBER
2010
NOTES
348
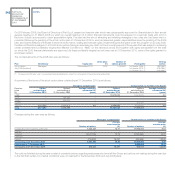
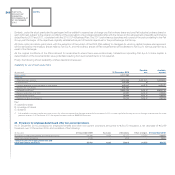
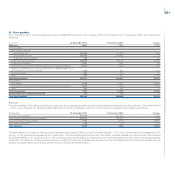
21. Non-current financial liabilities
At 31 December 2010, non-current financial liabilities totaled €2,561,442 thousand, an increase of €744,660 thousand over 31 December 2009,
and included the following:
(€ thousand) 31 December 2010 31 December 2009 Change
Financial payables to Group companies 2,550,000 1,800,000 750,000
Financial guarantees 11,442 16,782 (5,340)
Total non-current financial liabilities 2,561,442 1,816,782 744,660
Financial payables to Group companies related to euro-denominated loans received from Fiat Finance S.p.A. which are due beyond 12 months. Interest is
payable on those loans at rates between 6.81% and 7.18%. The amount reported at 31 December 2010 is net of €1,050,000 thousand reclassified under
“Liabilities to be demerged” (see Note 18), representing non-current financial payables to be demerged to Fiat Industrial S.p.A. as a result of the Demerger.
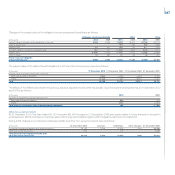
Principal changes during 2010 included repayment of a €400 million loan received on 24/05/2006 (maturing 24/02/2010 with interest of 6.35% p.a.),
in addition to two new variable rate loans received, respectively, on 05/03/2010 for €400 million (maturing 05/03/2012) and on 23/06/2010 for €750 million
(maturing 22/06/2012).
The breakdown of loans by maturity is as follows:
(€ thousand)
31 December 2010
Maturing in 2011 400,000
Maturing in 2012 1,150,000
Maturing in 2013 1,000,000
Total financial payables to Group companies 2,550,000
The fair value of these loans at 31 December 2010 was €2.7 billion and was calculated using market rates of interest appropriately adjusted to reflect the
credit spreads applicable to Fiat at the balance sheet date.
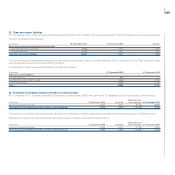
The item financial guarantees represents the fair value of the liabilities assumed in relation to guarantees issued. After assessing the potential risks in relation
to which contingent liabilities must be recognized and given that this item relates essentially to guarantees provided in relation to loans received by Group
companies, it has been concluded that the present value of fees receivable for guarantees issued (see other financial assets in Note 12) represented the best
estimate of the fair value of these guarantees.
The breakdown by maturity date is as follows:
(€ thousand)
31 December 2010 31 December 2009
Financial guarantees
due within one year 3,593 5,344
due after one year but within five years 7,746 11,145
due beyond five years 103 293
Total 11,442 16,782