Chrysler 2010 Annual Report Download - page 257
Download and view the complete annual report
Please find page 257 of the 2010 Chrysler annual report below. You can navigate through the pages in the report by either clicking on the pages listed below, or by using the keyword search tool below to find specific information within the annual report.-
 1
1 -
2
-
3
-
4
-
5
-
6
-
7
-
8
-
9
-
10
-
11
-
12
-
13
-
14
-
15
-
16
-
17
-
18
-
19
-
20
-
21
-
22
-
23
-
24
-
25
-
26
-
27
-
28
-
29
-
30
-
31
-
32
-
33
-
34
-
35
-
36
-
37
-
38
-
39
-
40
-
41
-
42
-
43
-
44
-
45
-
46
-
47
-
48
-
49
-
50
-
51
-
52
-
53
-
54
-
55
-
56
-
57
-
58
-
59
-
60
-
61
-
62
-
63
-
64
-
65
-
66
-
67
-
68
-
69
-
70
-
71
-
72
-
73
-
74
-
75
-
76
-
77
-
78
-
79
-
80
-
81
-
82
-
83
-
84
-
85
-
86
-
87
-
88
-
89
-
90
-
91
-
92
-
93
-
94
-
95
-
96
-
97
-
98
-
99
-
100
-
101
-
102
-
103
-
104
-
105
-
106
-
107
-
108
-
109
-
110
-
111
-
112
-
113
-
114
-
115
-
116
-
117
-
118
-
119
-
120
-
121
-
122
-
123
-
124
-
125
-
126
-
127
-
128
-
129
-
130
-
131
-
132
-
133
-
134
-
135
-
136
-
137
-
138
-
139
-
140
-
141
-
142
-
143
-
144
-
145
-
146
-
147
-
148
-
149
-
150
-
151
-
152
-
153
-
154
-
155
-
156
-
157
-
158
-
159
-
160
-
161
-
162
-
163
-
164
-
165
-
166
-
167
-
168
-
169
-
170
-
171
-
172
-
173
-
174
-
175
-
176
-
177
-
178
-
179
-
180
-
181
-
182
-
183
-
184
-
185
-
186
-
187
-
188
-
189
-
190
-
191
-
192
-
193
-
194
-
195
-
196
-
197
-
198
-
199
-
200
-
201
-
202
-
203
-
204
-
205
-
206
-
207
-
208
-
209
-
210
-
211
-
212
-
213
-
214
-
215
-
216
-
217
-
218
-
219
-
220
-
221
-
222
-
223
-
224
-
225
-
226
-
227
-
228
-
229
-
230
-
231
-
232
-
233
-
234
-
235
-
236
-
237
-
238
-
239
-
240
-
241
-
242
-
243
-
244
-
245
-
246
-
 247
247 -
 248
248 -
 249
249 -
 250
250 -
 251
251 -
 252
252 -
 253
253 -
 254
254 -
 255
255 -
 256
256 -
 257
257 -
 258
258 -
 259
259 -
 260
260 -
 261
261 -
 262
262 -
 263
263 -
 264
264 -
 265
265 -
 266
266 -
 267
267 -
268
-
269
-
270
-
271
-
272
-
273
-
274
-
275
-
276
-
277
-
278
-
279
-
280
-
281
-
282
-
283
-
284
-
285
-
286
-
287
-
288
-
289
-
290
-
291
-
292
-
293
-
294
-
295
-
296
-
297
-
298
-
299
-
300
-
301
-
302
-
303
-
304
-
305
-
306
-
307
-
308
-
309
-
310
-
311
-
312
-
313
-
314
-
315
-
316
-
317
-
318
-
319
-
320
-
321
-
322
-
323
-
324
-
325
-
326
-
327
-
328
-
329
-
330
-
331
-
332
-
333
-
334
-
335
-
336
-
337
-
338
-
339
-
340
-
341
-
342
-
343
-
344
-
345
-
346
-
347
-
348
-
349
-
350
-
351
-
352
-
353
-
354
-
355
-
356
-
357
-
358
-
359
-
360
-
361
-
362
-
363
-
364
-
365
-
366
-
367
-
368
-
369
-
370
-
371
-
372
-
373
-
374
-
375
-
376
-
377
-
378
-
379
-
380
-
381
-
382
-
383
-
384
-
385
-
386
-
387
-
388
-
389
-
390
-
391
-
392
-
393
-
394
-
395
-
396
-
397
-
398
-
399
-
400
-
401
-
402
 |
 |

FIAT GROUP
CONSOLIDATED
FINANCIAL
STATEMENTS
AT 31 DECEMBER
2010
NOTES
256
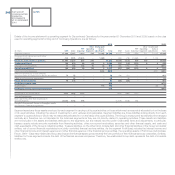
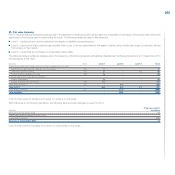
The following table provides an analysis under this hierarchy of financial assets and liabilities classified as Discontinued Operations at 31 December 2010
and measured at fair value.
(€ million) Note Level 1 Level 2 Level 3 Total
Assets at fair value with changes directly in Other comprehensive income:
Investments at fair value with changes directly in equity (16) - - - -
Other Non current securities (16) 1 - - 1
Current securities available for sale (20) 24 - - 24
Financial assets at fair value held for trading:
Current investments - - - -
Current securities held for trading (20) - - - -
Other financial assets (21) - 88 - 88
Total Assets 25 88 - 113
Other financial liabilities (21) - (143) (4) (147)
Total Liabilities - (143) (4) (147)
In 2010 there were no transfers from Level 1 to Level 2 or vice versa.
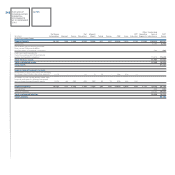
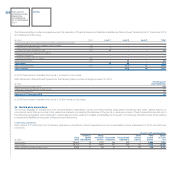
With reference to Discontinued Operations, the following table provides changes in Level 3 in 2010:
Other financial
(€ million) asset/(liabilities)
Balances at 31 December 2009 (18)
(Gains) and losses recognised in profit or loss 17
Increases/(Decreases) (3)
Balances at 31 December 2010 (4)
In 2010 there were no transfers from Level 3 to other levels or vice versa.
34. Related party transactions
The Group engages in transactions with unconsolidated subsidiaries, jointly controlled entities, associated companies and other related parties on
commercial terms that are normal in the respective markets, considering the features of the goods or services involved. These transactions are set out in
the following paragraphs with a distinction made between those relating to assets and liabilities forming part of Continuing Operations and those relating
to assets and liabilities forming part of Discontinued Operations.
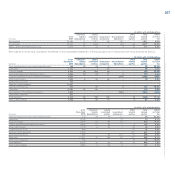
Continuing Operations
With respect to Profit/(loss) from Continuing Operations, the effects of such transactions on the consolidated income statements for 2010 and 2009 are
as follows:
of which: with related parties
Unconso- Jointly Other Total Effect
Total lidated controlled Associated Discontinued related related on Total
(€ million) 2010 Subsidiaries entities companies Operations parties parties (%)
Net revenues 35,880 19 1,730 244 592 1 2,586 7.2%
Cost of sales 30,718 71 2,995 231 362 83 3,742 12.2%
Selling, general and administrative costs 2,956 17 20 37 2 63 139 4.7%