Chrysler 2010 Annual Report Download - page 170
Download and view the complete annual report
Please find page 170 of the 2010 Chrysler annual report below. You can navigate through the pages in the report by either clicking on the pages listed below, or by using the keyword search tool below to find specific information within the annual report.-
 1
1 -
2
-
3
-
4
-
5
-
6
-
7
-
8
-
9
-
10
-
11
-
12
-
13
-
14
-
15
-
16
-
17
-
18
-
19
-
20
-
21
-
22
-
23
-
24
-
25
-
26
-
27
-
28
-
29
-
30
-
31
-
32
-
33
-
34
-
35
-
36
-
37
-
38
-
39
-
40
-
41
-
42
-
43
-
44
-
45
-
46
-
47
-
48
-
49
-
50
-
51
-
52
-
53
-
54
-
55
-
56
-
57
-
58
-
59
-
60
-
61
-
62
-
63
-
64
-
65
-
66
-
67
-
68
-
69
-
70
-
71
-
72
-
73
-
74
-
75
-
76
-
77
-
78
-
79
-
80
-
81
-
82
-
83
-
84
-
85
-
86
-
87
-
88
-
89
-
90
-
91
-
92
-
93
-
94
-
95
-
96
-
97
-
98
-
99
-
100
-
101
-
102
-
103
-
104
-
105
-
106
-
107
-
108
-
109
-
110
-
111
-
112
-
113
-
114
-
115
-
116
-
117
-
118
-
119
-
120
-
121
-
122
-
123
-
124
-
125
-
126
-
127
-
128
-
129
-
130
-
131
-
132
-
133
-
134
-
135
-
136
-
137
-
138
-
139
-
140
-
141
-
142
-
143
-
144
-
145
-
146
-
147
-
148
-
149
-
150
-
151
-
152
-
153
-
154
-
155
-
156
-
157
-
158
-
159
-
 160
160 -
 161
161 -
 162
162 -
 163
163 -
 164
164 -
 165
165 -
 166
166 -
 167
167 -
 168
168 -
 169
169 -
 170
170 -
 171
171 -
 172
172 -
 173
173 -
 174
174 -
 175
175 -
 176
176 -
 177
177 -
 178
178 -
 179
179 -
 180
180 -
181
-
182
-
183
-
184
-
185
-
186
-
187
-
188
-
189
-
190
-
191
-
192
-
193
-
194
-
195
-
196
-
197
-
198
-
199
-
200
-
201
-
202
-
203
-
204
-
205
-
206
-
207
-
208
-
209
-
210
-
211
-
212
-
213
-
214
-
215
-
216
-
217
-
218
-
219
-
220
-
221
-
222
-
223
-
224
-
225
-
226
-
227
-
228
-
229
-
230
-
231
-
232
-
233
-
234
-
235
-
236
-
237
-
238
-
239
-
240
-
241
-
242
-
243
-
244
-
245
-
246
-
247
-
248
-
249
-
250
-
251
-
252
-
253
-
254
-
255
-
256
-
257
-
258
-
259
-
260
-
261
-
262
-
263
-
264
-
265
-
266
-
267
-
268
-
269
-
270
-
271
-
272
-
273
-
274
-
275
-
276
-
277
-
278
-
279
-
280
-
281
-
282
-
283
-
284
-
285
-
286
-
287
-
288
-
289
-
290
-
291
-
292
-
293
-
294
-
295
-
296
-
297
-
298
-
299
-
300
-
301
-
302
-
303
-
304
-
305
-
306
-
307
-
308
-
309
-
310
-
311
-
312
-
313
-
314
-
315
-
316
-
317
-
318
-
319
-
320
-
321
-
322
-
323
-
324
-
325
-
326
-
327
-
328
-
329
-
330
-
331
-
332
-
333
-
334
-
335
-
336
-
337
-
338
-
339
-
340
-
341
-
342
-
343
-
344
-
345
-
346
-
347
-
348
-
349
-
350
-
351
-
352
-
353
-
354
-
355
-
356
-
357
-
358
-
359
-
360
-
361
-
362
-
363
-
364
-
365
-
366
-
367
-
368
-
369
-
370
-
371
-
372
-
373
-
374
-
375
-
376
-
377
-
378
-
379
-
380
-
381
-
382
-
383
-
384
-
385
-
386
-
387
-
388
-
389
-
390
-
391
-
392
-
393
-
394
-
395
-
396
-
397
-
398
-
399
-
400
-
401
-
402
 |
 |

169
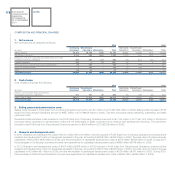
The exposure to interest rate risk arises from the need to fund industrial and financial operating activities and the necessity to
deploy surplus funds. Changes in market interest rates may have the effect of either increasing or decreasing the Group’s net
profit/(loss), thereby indirectly affecting the costs and returns of financing and investing transactions.
The Group regularly assesses its exposure to interest rate and foreign currency risk and manages those risks through the use
of derivative financial instruments in accordance with its established risk management policies.
The Group’s policy permits derivatives to be used only for managing the exposure to fluctuations in exchange and interest rates
connected with future cash flows and assets and liabilities, and not for speculative purposes.
The Group utilises derivative financial instruments designated as fair value hedges, mainly to hedge:
the currency risk on financial instruments denominated in foreign currency;
the interest rate risk on fixed rate loans and borrowings.
The instruments used for these hedges are mainly currency swaps, forward contracts, interest rate swaps and combined
interest rate and currency financial instruments.
The Group uses derivative financial instruments as cash flow hedges for the purpose of pre-determining:
the exchange rate at which forecasted transactions denominated in foreign currencies will be accounted for;
the interest paid on borrowings, both to match the fixed interest received on loans (customer financing activity), and to
achieve a pre-defined mix of floating versus fixed rate funding structured loans.
The exchange rate exposure on forecasted commercial flows is hedged by currency swaps, forward contracts and currency
options. Interest rate exposures are usually hedged by interest rate swaps and, in limited cases, by forward rate agreements.
Counterparties to these agreements are major and diverse financial institutions.
Information on the fair value of derivative financial instruments held at the balance sheet date is provided in Note 21.
Additional qualitative information on the financial risks to which the Group is exposed is provided in Note 32.
SCOPE OF CONSOLIDATION
The consolidated financial statements of the Fiat Group at 31 December 2010 include Fiat S.p.A. and 418 consolidated
subsidiaries in which Fiat S.p.A., directly or indirectly, has a majority of the voting rights, over which it exercises control, or from
which it is able to derive benefit by virtue of its power to govern corporate financial and operating policies. One more subsidiary
was consolidated at 31 December 2010 compared to 31 December 2009.
Excluded from consolidation are 76 subsidiaries that are either dormant or generate a negligible volume of business: their
proportion of the Group’s assets, liabilities, financial position and earnings is immaterial. In particular, 50 of such subsidiaries are
accounted for using the cost method, and represent in aggregate 0 percent of total Fiat Group revenues (Continuing Operations
and Discontinued Operations), 0 percent of the Fiat Group equity and 0.21 percent of total Fiat Group assets.