Chrysler 2010 Annual Report Download - page 120
Download and view the complete annual report
Please find page 120 of the 2010 Chrysler annual report below. You can navigate through the pages in the report by either clicking on the pages listed below, or by using the keyword search tool below to find specific information within the annual report.-
 1
1 -
2
-
3
-
4
-
5
-
6
-
7
-
8
-
9
-
10
-
11
-
12
-
13
-
14
-
15
-
16
-
17
-
18
-
19
-
20
-
21
-
22
-
23
-
24
-
25
-
26
-
27
-
28
-
29
-
30
-
31
-
32
-
33
-
34
-
35
-
36
-
37
-
38
-
39
-
40
-
41
-
42
-
43
-
44
-
45
-
46
-
47
-
48
-
49
-
50
-
51
-
52
-
53
-
54
-
55
-
56
-
57
-
58
-
59
-
60
-
61
-
62
-
63
-
64
-
65
-
66
-
67
-
68
-
69
-
70
-
71
-
72
-
73
-
74
-
75
-
76
-
77
-
78
-
79
-
80
-
81
-
82
-
83
-
84
-
85
-
86
-
87
-
88
-
89
-
90
-
91
-
92
-
93
-
94
-
95
-
96
-
97
-
98
-
99
-
100
-
101
-
102
-
103
-
104
-
105
-
106
-
107
-
108
-
109
-
 110
110 -
 111
111 -
 112
112 -
 113
113 -
 114
114 -
 115
115 -
 116
116 -
 117
117 -
 118
118 -
 119
119 -
 120
120 -
 121
121 -
 122
122 -
 123
123 -
 124
124 -
 125
125 -
 126
126 -
 127
127 -
 128
128 -
 129
129 -
 130
130 -
131
-
132
-
133
-
134
-
135
-
136
-
137
-
138
-
139
-
140
-
141
-
142
-
143
-
144
-
145
-
146
-
147
-
148
-
149
-
150
-
151
-
152
-
153
-
154
-
155
-
156
-
157
-
158
-
159
-
160
-
161
-
162
-
163
-
164
-
165
-
166
-
167
-
168
-
169
-
170
-
171
-
172
-
173
-
174
-
175
-
176
-
177
-
178
-
179
-
180
-
181
-
182
-
183
-
184
-
185
-
186
-
187
-
188
-
189
-
190
-
191
-
192
-
193
-
194
-
195
-
196
-
197
-
198
-
199
-
200
-
201
-
202
-
203
-
204
-
205
-
206
-
207
-
208
-
209
-
210
-
211
-
212
-
213
-
214
-
215
-
216
-
217
-
218
-
219
-
220
-
221
-
222
-
223
-
224
-
225
-
226
-
227
-
228
-
229
-
230
-
231
-
232
-
233
-
234
-
235
-
236
-
237
-
238
-
239
-
240
-
241
-
242
-
243
-
244
-
245
-
246
-
247
-
248
-
249
-
250
-
251
-
252
-
253
-
254
-
255
-
256
-
257
-
258
-
259
-
260
-
261
-
262
-
263
-
264
-
265
-
266
-
267
-
268
-
269
-
270
-
271
-
272
-
273
-
274
-
275
-
276
-
277
-
278
-
279
-
280
-
281
-
282
-
283
-
284
-
285
-
286
-
287
-
288
-
289
-
290
-
291
-
292
-
293
-
294
-
295
-
296
-
297
-
298
-
299
-
300
-
301
-
302
-
303
-
304
-
305
-
306
-
307
-
308
-
309
-
310
-
311
-
312
-
313
-
314
-
315
-
316
-
317
-
318
-
319
-
320
-
321
-
322
-
323
-
324
-
325
-
326
-
327
-
328
-
329
-
330
-
331
-
332
-
333
-
334
-
335
-
336
-
337
-
338
-
339
-
340
-
341
-
342
-
343
-
344
-
345
-
346
-
347
-
348
-
349
-
350
-
351
-
352
-
353
-
354
-
355
-
356
-
357
-
358
-
359
-
360
-
361
-
362
-
363
-
364
-
365
-
366
-
367
-
368
-
369
-
370
-
371
-
372
-
373
-
374
-
375
-
376
-
377
-
378
-
379
-
380
-
381
-
382
-
383
-
384
-
385
-
386
-
387
-
388
-
389
-
390
-
391
-
392
-
393
-
394
-
395
-
396
-
397
-
398
-
399
-
400
-
401
-
402
 |
 |

119
AGRICULTURAL
AND CONSTRUCTION EQUIPMENT
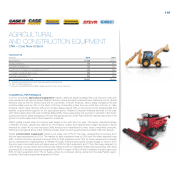
CNH – Case New Holland
HIGHLIGHTS
(€ million) 2010 2009
Net revenues 11,906 10,107
Trading profit/(loss) 755 337
Operating profit/(loss) (*) 754 251
Investments in tangible and intangible assets (**) 446 330
of which capitalized R&D costs 200 151
Total R&D expenditure (***) 346 283
No. of employees at year end 28,831 28,466
(*) Includes restructuring costs and other unusual income/(expense)
(**) Net of vehicles leased out
(***) Includes capitalized R&D and R&D charged directly to the income statement
COMMERCIAL PERFORMANCE
In 2010, worldwide agricultural equipment industry retail unit sales increased 8% over the prior year with
improvements in all regions except Western Europe, where demand remained below historical norms. Global
demand was up 8% for tractors and 2% for combines. In North America, tractor sales increased 5% and
combine sales were up 9% on the back of strong commodity prices and very solid farm income. In Latin
America, tractor sales climbed 20% and combine sales jumped 29% on strong economic fundamentals and
stability in government support for the agricultural sector. Western European markets declined for the year
with tractor sales down 9% and combines falling 29%. There were signs of a recovery in demand in the fourth
quarter with tractor sales increasing 12% over the same period in 2009. Rest of World markets reported a 13%
growth in tractor sales and a 3% increase for combines.
CNH’s global market share for tractors was largely in line with the prior year. The sector maintained share
in Western Europe, despite the decline for the industry overall, and experienced a slight decrease in North
America for under 40 hp and mid-sized utility tractors as it transitioned to new, more competitive products.
CNH improved global share of the combine market driven by strong performance in Rest of World markets.
Global construction equipment industry unit sales rose 47% for the year, representing a recovery from
the low base experienced in 2009. The market for light equipment was up 35% and the heavy segment rose
59%. In North America, demand improved 20% for light equipment and 14% for heavy equipment principally
due to replacement of ageing fleets. In Western Europe, demand grew as the industry began to recover from
the prior year’s low levels, and unit sales were up 23% for light equipment and 17% in the heavy segment. In
Latin America, strong market performance was mainly driven by increased infrastructure spending, with sales
growing 89% in the light equipment segment and 86% in heavy. In Rest of World markets, industry sales rose
50% for light equipment and 71% for heavy, driven by continued strong demand in the Asia-Pacific region,
primarily in the heavy equipment segment in China.