Chrysler 2010 Annual Report Download - page 70
Download and view the complete annual report
Please find page 70 of the 2010 Chrysler annual report below. You can navigate through the pages in the report by either clicking on the pages listed below, or by using the keyword search tool below to find specific information within the annual report.-
 1
1 -
2
-
3
-
4
-
5
-
6
-
7
-
8
-
9
-
10
-
11
-
12
-
13
-
14
-
15
-
16
-
17
-
18
-
19
-
20
-
21
-
22
-
23
-
24
-
25
-
26
-
27
-
28
-
29
-
30
-
31
-
32
-
33
-
34
-
35
-
36
-
37
-
38
-
39
-
40
-
41
-
42
-
43
-
44
-
45
-
46
-
47
-
48
-
49
-
50
-
51
-
52
-
53
-
54
-
55
-
56
-
57
-
58
-
59
-
 60
60 -
 61
61 -
 62
62 -
 63
63 -
 64
64 -
 65
65 -
 66
66 -
 67
67 -
 68
68 -
 69
69 -
 70
70 -
 71
71 -
 72
72 -
 73
73 -
 74
74 -
 75
75 -
 76
76 -
 77
77 -
 78
78 -
 79
79 -
 80
80 -
81
-
82
-
83
-
84
-
85
-
86
-
87
-
88
-
89
-
90
-
91
-
92
-
93
-
94
-
95
-
96
-
97
-
98
-
99
-
100
-
101
-
102
-
103
-
104
-
105
-
106
-
107
-
108
-
109
-
110
-
111
-
112
-
113
-
114
-
115
-
116
-
117
-
118
-
119
-
120
-
121
-
122
-
123
-
124
-
125
-
126
-
127
-
128
-
129
-
130
-
131
-
132
-
133
-
134
-
135
-
136
-
137
-
138
-
139
-
140
-
141
-
142
-
143
-
144
-
145
-
146
-
147
-
148
-
149
-
150
-
151
-
152
-
153
-
154
-
155
-
156
-
157
-
158
-
159
-
160
-
161
-
162
-
163
-
164
-
165
-
166
-
167
-
168
-
169
-
170
-
171
-
172
-
173
-
174
-
175
-
176
-
177
-
178
-
179
-
180
-
181
-
182
-
183
-
184
-
185
-
186
-
187
-
188
-
189
-
190
-
191
-
192
-
193
-
194
-
195
-
196
-
197
-
198
-
199
-
200
-
201
-
202
-
203
-
204
-
205
-
206
-
207
-
208
-
209
-
210
-
211
-
212
-
213
-
214
-
215
-
216
-
217
-
218
-
219
-
220
-
221
-
222
-
223
-
224
-
225
-
226
-
227
-
228
-
229
-
230
-
231
-
232
-
233
-
234
-
235
-
236
-
237
-
238
-
239
-
240
-
241
-
242
-
243
-
244
-
245
-
246
-
247
-
248
-
249
-
250
-
251
-
252
-
253
-
254
-
255
-
256
-
257
-
258
-
259
-
260
-
261
-
262
-
263
-
264
-
265
-
266
-
267
-
268
-
269
-
270
-
271
-
272
-
273
-
274
-
275
-
276
-
277
-
278
-
279
-
280
-
281
-
282
-
283
-
284
-
285
-
286
-
287
-
288
-
289
-
290
-
291
-
292
-
293
-
294
-
295
-
296
-
297
-
298
-
299
-
300
-
301
-
302
-
303
-
304
-
305
-
306
-
307
-
308
-
309
-
310
-
311
-
312
-
313
-
314
-
315
-
316
-
317
-
318
-
319
-
320
-
321
-
322
-
323
-
324
-
325
-
326
-
327
-
328
-
329
-
330
-
331
-
332
-
333
-
334
-
335
-
336
-
337
-
338
-
339
-
340
-
341
-
342
-
343
-
344
-
345
-
346
-
347
-
348
-
349
-
350
-
351
-
352
-
353
-
354
-
355
-
356
-
357
-
358
-
359
-
360
-
361
-
362
-
363
-
364
-
365
-
366
-
367
-
368
-
369
-
370
-
371
-
372
-
373
-
374
-
375
-
376
-
377
-
378
-
379
-
380
-
381
-
382
-
383
-
384
-
385
-
386
-
387
-
388
-
389
-
390
-
391
-
392
-
393
-
394
-
395
-
396
-
397
-
398
-
399
-
400
-
401
-
402
 |
 |

69
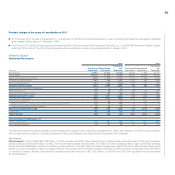
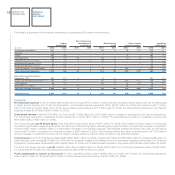
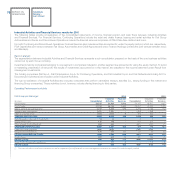
Trading profit/(loss)
Fiat Group posted 2010 trading profit of €2,204 million (€1,058 million for 2009). Trading profit for Continuing Operations was €1,112 million (trading
margin: 3.1%), compared with €736 million for 2009 (trading margin: 2.3%), and Discontinued Operations reported a trading profit of €1,092 million
(trading margin: 5.1%), up from €322 million for 2009 (trading margin: 1.8%). Overall, the improvements were driven by higher volumes, with the exception
of passenger cars for FGA, better product mix and continued focus on costs and industrial efficiencies.
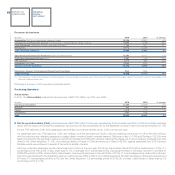
Trading profit/(loss) by business
(€ million) 2010 2009 Change
Automobiles (Fiat Group Automobiles, Maserati, Ferrari) 934 719 215
Components and Production Systems (Fiat Powertrain (1), Magneti Marelli, Teksid, Comau) 249 89 160
Other Businesses (Publishing, Holding Companies and Other) and Eliminations (71) (72) 1
Total Continuing Operations 1,112 736 376
Trading margin (%) 3.1 2.3
Agricultural and Construction Equipment (CNH-Case New Holland) 755 337 418
Trucks and Commercial Vehicles (Iveco) 270 105 165
FPT Industrial (1) 65 (131) 196
Eliminations and Other 2 11 -9
Total Discontinued Operations 1,092 322 770
Trading margin (%) 5.1 1.8
Total Fiat Group 2,204 1,058 1,146
Trading margin (%) 3.9 2.1
(1) Fiat Powertrain comprises the activities of the Passenger & Commercial Vehicles business line of the former FPT Powertrain Technologies, while FPT Industrial comprises the activities of the
Industrial & Marine business line
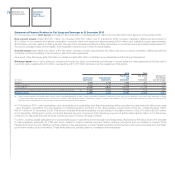
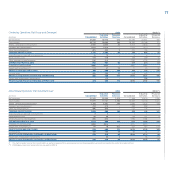
Following is a discussion of trading profit by business/sector:
Continuing Operations
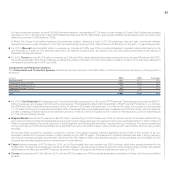
Automobiles
The Automobiles businesses reported trading profit of €934 million for 2010, up €215 million over the €719 million figure for 2009. All sectors contributed
to the growth.
(€ million) 2010 2009 Change
Fiat Group Automobiles 607 470 137
Maserati 24 11 13
Ferrari 303 238 65
Total 934 719 215
Trading margin (%) 3.1 2.5