Chrysler 2010 Annual Report Download - page 188
Download and view the complete annual report
Please find page 188 of the 2010 Chrysler annual report below. You can navigate through the pages in the report by either clicking on the pages listed below, or by using the keyword search tool below to find specific information within the annual report.-
 1
1 -
2
-
3
-
4
-
5
-
6
-
7
-
8
-
9
-
10
-
11
-
12
-
13
-
14
-
15
-
16
-
17
-
18
-
19
-
20
-
21
-
22
-
23
-
24
-
25
-
26
-
27
-
28
-
29
-
30
-
31
-
32
-
33
-
34
-
35
-
36
-
37
-
38
-
39
-
40
-
41
-
42
-
43
-
44
-
45
-
46
-
47
-
48
-
49
-
50
-
51
-
52
-
53
-
54
-
55
-
56
-
57
-
58
-
59
-
60
-
61
-
62
-
63
-
64
-
65
-
66
-
67
-
68
-
69
-
70
-
71
-
72
-
73
-
74
-
75
-
76
-
77
-
78
-
79
-
80
-
81
-
82
-
83
-
84
-
85
-
86
-
87
-
88
-
89
-
90
-
91
-
92
-
93
-
94
-
95
-
96
-
97
-
98
-
99
-
100
-
101
-
102
-
103
-
104
-
105
-
106
-
107
-
108
-
109
-
110
-
111
-
112
-
113
-
114
-
115
-
116
-
117
-
118
-
119
-
120
-
121
-
122
-
123
-
124
-
125
-
126
-
127
-
128
-
129
-
130
-
131
-
132
-
133
-
134
-
135
-
136
-
137
-
138
-
139
-
140
-
141
-
142
-
143
-
144
-
145
-
146
-
147
-
148
-
149
-
150
-
151
-
152
-
153
-
154
-
155
-
156
-
157
-
158
-
159
-
160
-
161
-
162
-
163
-
164
-
165
-
166
-
167
-
168
-
169
-
170
-
171
-
172
-
173
-
174
-
175
-
176
-
177
-
 178
178 -
 179
179 -
 180
180 -
 181
181 -
 182
182 -
 183
183 -
 184
184 -
 185
185 -
 186
186 -
 187
187 -
 188
188 -
 189
189 -
 190
190 -
 191
191 -
 192
192 -
 193
193 -
 194
194 -
 195
195 -
 196
196 -
 197
197 -
 198
198 -
199
-
200
-
201
-
202
-
203
-
204
-
205
-
206
-
207
-
208
-
209
-
210
-
211
-
212
-
213
-
214
-
215
-
216
-
217
-
218
-
219
-
220
-
221
-
222
-
223
-
224
-
225
-
226
-
227
-
228
-
229
-
230
-
231
-
232
-
233
-
234
-
235
-
236
-
237
-
238
-
239
-
240
-
241
-
242
-
243
-
244
-
245
-
246
-
247
-
248
-
249
-
250
-
251
-
252
-
253
-
254
-
255
-
256
-
257
-
258
-
259
-
260
-
261
-
262
-
263
-
264
-
265
-
266
-
267
-
268
-
269
-
270
-
271
-
272
-
273
-
274
-
275
-
276
-
277
-
278
-
279
-
280
-
281
-
282
-
283
-
284
-
285
-
286
-
287
-
288
-
289
-
290
-
291
-
292
-
293
-
294
-
295
-
296
-
297
-
298
-
299
-
300
-
301
-
302
-
303
-
304
-
305
-
306
-
307
-
308
-
309
-
310
-
311
-
312
-
313
-
314
-
315
-
316
-
317
-
318
-
319
-
320
-
321
-
322
-
323
-
324
-
325
-
326
-
327
-
328
-
329
-
330
-
331
-
332
-
333
-
334
-
335
-
336
-
337
-
338
-
339
-
340
-
341
-
342
-
343
-
344
-
345
-
346
-
347
-
348
-
349
-
350
-
351
-
352
-
353
-
354
-
355
-
356
-
357
-
358
-
359
-
360
-
361
-
362
-
363
-
364
-
365
-
366
-
367
-
368
-
369
-
370
-
371
-
372
-
373
-
374
-
375
-
376
-
377
-
378
-
379
-
380
-
381
-
382
-
383
-
384
-
385
-
386
-
387
-
388
-
389
-
390
-
391
-
392
-
393
-
394
-
395
-
396
-
397
-
398
-
399
-
400
-
401
-
402
 |
 |

187
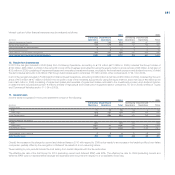
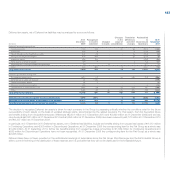
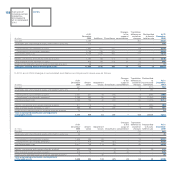
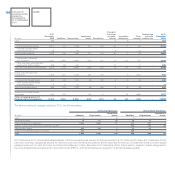
The figures used to determine diluted earnings per shares for the Fiat Group are as follows:
2010 2009
Ordinary Preference Savings Ordinary Preference Savings
shares shares shares Total shares shares shares Total
Profit/(Loss) attributable to each class
of shares € million 433 42 45 520 (714) (70) (54) (838)
Weighted average number of shares outstanding thousand 1,053,679 103,292 79,913 1,236,884 1,053,679 103,292 79,913 1,236,884
Number of shares deployable
for stock option plans thousand 5,936 - - 5,936 - - - -
Number of shares considered
in the diluted earnings per share thousand 1,059,615 103,292 79,913 1,242,820 1,053,679 103,292 79,913 1,236,884
Diluted Earnings/(loss) per share € 0.409 0.409 0.564 (0.677) (0.677) (0.677)
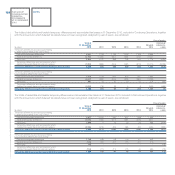
The figures used to determine diluted earnings per shares for the Continuing and Discontinued Operations are as follows:
2010 2009
Ordinary Preference Savings Ordinary Preference Savings
shares shares shares Total shares shares shares Total
Profit/(Loss) from Continuing Operations
attributable to each class of shares € million 137 23 19 179 (319) (31) (24) (374)
Profit/(Loss) from Discontinued Operations
attributable to each class of shares € million 287 28 26 341 (397) (38) (29) (464)
Weighted average number of shares outstanding thousand 1,053,679 103,292 79,913 1,236,884 1,053,679 103,292 79,913 1,236,884
Number of shares deployable
for stock option plans thousand 5,936 - - 5,936 - - - -
Number of shares considered in the diluted
earnings per share thousand 1,059,615 103,292 79,913 1,242,820 1,053,679 103,292 79,913 1,236,884
Diluted Earnings/(loss)
per share – Continuing Operations € 0.130 0.217 0.238 (0.302) (0.302) (0.302)
Diluted Earnings/(loss)
per share – Discontinued Operations € 0.272 0.272 0.318 (0.375) (0.375) (0.375)
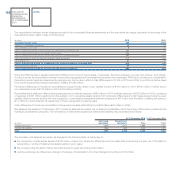
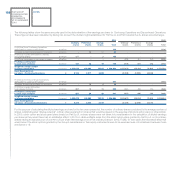
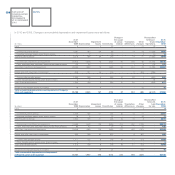
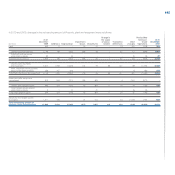
14. Intangible assets
In 2010 and 2009, changes in the gross carrying amount of Intangible assets were as follows:
Changes Translation Reclassified
At 31 in the differences to At 31
December scope of and other Discontinued December
(€ million) 2009 Additions Divestitures consolidation changes Operations 2010
Goodwill 3,437 - - - 194 (2,359) 1,272
Trademarks and other intangible assets with indefinite useful lives 206 - - - 16 (219) 3
Development costs externally acquired 3,343 357 (20) - 18 (582) 3,116
Development costs internally generated 4,504 925 (8) - 112 (2,026) 3,507
Total Development costs 7,847 1,282 (28) - 130 (2,608) 6,623
Patents, concessions and licenses externally acquired 1,276 78 (3) 2 27 (638) 742
Other intangible assets externally acquired 890 86 (48) 3 46 (423) 554
Advances and intangible assets in progress externally acquired 31 12 - - (7) (7) 29
Total gross carrying amount of Intangible assets 13,687 1,458 (79) 5 406 (6,254) 9,223