Travelers 2004 Annual Report Download - page 96
Download and view the complete annual report
Please find page 96 of the 2004 Travelers annual report below. You can navigate through the pages in the report by either clicking on the pages listed below, or by using the keyword search tool below to find specific information within the annual report.-
 1
1 -
2
-
3
-
4
-
5
-
6
-
7
-
8
-
9
-
10
-
11
-
12
-
13
-
14
-
15
-
16
-
17
-
18
-
19
-
20
-
21
-
22
-
23
-
24
-
25
-
26
-
27
-
28
-
29
-
30
-
31
-
32
-
33
-
34
-
35
-
36
-
37
-
38
-
39
-
40
-
41
-
42
-
43
-
44
-
45
-
46
-
47
-
48
-
49
-
50
-
51
-
52
-
53
-
54
-
55
-
56
-
57
-
58
-
59
-
60
-
61
-
62
-
63
-
64
-
65
-
66
-
67
-
68
-
69
-
70
-
71
-
72
-
73
-
74
-
75
-
76
-
77
-
78
-
79
-
80
-
81
-
82
-
83
-
84
-
85
-
 86
86 -
 87
87 -
 88
88 -
 89
89 -
 90
90 -
 91
91 -
 92
92 -
 93
93 -
 94
94 -
 95
95 -
 96
96 -
 97
97 -
 98
98 -
 99
99 -
 100
100 -
 101
101 -
 102
102 -
 103
103 -
 104
104 -
 105
105 -
 106
106 -
107
-
108
-
109
-
110
-
111
-
112
-
113
-
114
-
115
-
116
-
117
-
118
-
119
-
120
-
121
-
122
-
123
-
124
-
125
-
126
-
127
-
128
-
129
-
130
-
131
-
132
-
133
-
134
-
135
-
136
-
137
-
138
-
139
-
140
-
141
-
142
-
143
-
144
-
145
-
146
-
147
-
148
-
149
-
150
-
151
-
152
-
153
-
154
-
155
-
156
-
157
-
158
-
159
-
160
-
161
-
162
-
163
-
164
-
165
-
166
-
167
-
168
-
169
-
170
-
171
-
172
-
173
-
174
-
175
-
176
-
177
-
178
-
179
-
180
-
181
-
182
-
183
-
184
-
185
-
186
-
187
-
188
-
189
-
190
-
191
-
192
-
193
-
194
-
195
-
196
-
197
-
198
-
199
-
200
-
201
-
202
-
203
-
204
-
205
-
206
-
207
-
208
-
209
-
210
-
211
-
212
-
213
-
214
-
215
-
216
-
217
-
218
-
219
-
220
-
221
-
222
-
223
-
224
-
225
-
226
-
227
-
228
-
229
-
230
-
231
-
232
-
233
-
234
-
235
-
236
-
237
-
238
-
239
-
240
 |
 |
The Company also invests much smaller amounts in equity securities, venture capital and real estate. These
investment classes have the potential for higher returns but also involve varying degrees of risk, including less
stable rates of return and less liquidity.
The primary goal of the Company’s asset liability management process is to satisfy the insurance liabilities
and manage the interest rate risk embedded in those insurance liabilities. Generally, the expected principal and
interest payments produced by the Company’s fixed income portfolio adequately fund the estimated runoff of the
Company’s insurance reserves. Although this is not an exact cash flow match in each period, the substantial
degree by which the market value of the fixed income portfolio exceeds the present value of the net insurance
liabilities provides assurance of the Company’s ability to fund the payment of claims through the sale of
securities or a restructuring of the portfolio, if necessary, without jeopardizing its asset-liability management
objectives. The Company does not believe that the impact of selling securities before anticipated or the use of
credit facilities to pay for policyholder liabilities, if necessary, would have a material impact on future liquidity
or results of operations.
At December 31, 2004, total cash and short-term invested assets of $159 million were held at the holding
company level. These liquid assets were primarily funded by dividends received from the Company’s operating
subsidiaries. These liquid assets, combined with other sources of funds available, primarily additional dividends
from the Company’s operating subsidiaries, are considered sufficient to meet the liquidity requirements of the
Company. These liquidity requirements include primarily, shareholder dividends and debt service.
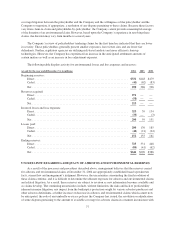
Net cash flows used in financing activities totaled $546 million, $1.10 billion and $800 million in 2004,
2003 and 2002, respectively. The 2004 outflows were primarily attributable to dividends paid to shareholders of
$642 million. Net maturities and retirements of debt, including the repurchase of CIRI’s outstanding notes,
totaled $75 million in 2004. In addition, the Company repurchased the minority interest in CIRI during the
second quarter for a total cost of $76 million.
Cash flows used in financing activities in 2003 were primarily attributable to the redemption of $900 million
aggregate principal amount of junior subordinated debt securities held by subsidiary trusts, the repayment of
$700 million of notes payable to a former affiliate and the repayment of $550 million of short-term debt. Funds
used in these repayments were primarily provided by the Company’s issuance of $1.40 billion of senior notes in
March 2003 and by cash flows provided by operating activities. These refinancing activities were initiated with
the objective of lowering the average interest rate on the Company’s total outstanding debt. Also reflected in
2003 was the issuance of $550 million of short-term Floating Rate Notes which were used to repay the $550
million Promissory Note due in January 2004. Net cash flows used in financing activities in 2003 also included
dividends paid to shareholders of $282 million. The 2002 cash flows used in financing activities reflects the
repayment of $6.35 billion of notes payable to Citigroup. These payments were partially offset by the receipt of
$4.09 billion from the first quarter 2002 initial public offering and the issuance of $917 million of convertible
notes payable.
The Company paid $636 million of common dividends in 2004, comprised of regular quarterly dividends
totaling $522 million and $114 million that had been declared by SPC prior to the merger. That amount consisted
of SPC’s regular quarterly dividend at a rate of $0.29 per share ($66 million), and a special $0.21 per share ($48
million) dividend related to the merger. The special dividend declared by SPC prior to the closing of the merger
was designed to result in the holders of SPC’s common stock prior to the merger receiving aggregate dividends
with record dates in 2004 of $1.16 per share, which was SPC’s indicated annual dividend rate prior to the merger.
On January 26, 2005, the Company’s Board of Directors declared a quarterly dividend of $0.22 per share,
payable March 31, 2005 to shareholders of record on March 10, 2005.
In 2004 and 2003, the Company acquired 0.4 million and 0.8 million shares (as adjusted for the merger),
respectively, of common stock from employees as treasury stock primarily to cover payroll withholding taxes in
connection with the vesting of restricted stock awards and exercises of stock options. In 2003, TPC repurchased
approximately 1.1 million shares (as adjusted for the merger) of common stock at a total cost of $40 million,
representing the acquisition of shares under a repurchase program that had been approved by TPC’s board of
directors. TPC’s repurchase program was terminated upon completion of the merger.
84