Travelers 2004 Annual Report Download - page 81
Download and view the complete annual report
Please find page 81 of the 2004 Travelers annual report below. You can navigate through the pages in the report by either clicking on the pages listed below, or by using the keyword search tool below to find specific information within the annual report.-
 1
1 -
2
-
3
-
4
-
5
-
6
-
7
-
8
-
9
-
10
-
11
-
12
-
13
-
14
-
15
-
16
-
17
-
18
-
19
-
20
-
21
-
22
-
23
-
24
-
25
-
26
-
27
-
28
-
29
-
30
-
31
-
32
-
33
-
34
-
35
-
36
-
37
-
38
-
39
-
40
-
41
-
42
-
43
-
44
-
45
-
46
-
47
-
48
-
49
-
50
-
51
-
52
-
53
-
54
-
55
-
56
-
57
-
58
-
59
-
60
-
61
-
62
-
63
-
64
-
65
-
66
-
67
-
68
-
69
-
70
-
 71
71 -
 72
72 -
 73
73 -
 74
74 -
 75
75 -
 76
76 -
 77
77 -
 78
78 -
 79
79 -
 80
80 -
 81
81 -
 82
82 -
 83
83 -
 84
84 -
 85
85 -
 86
86 -
 87
87 -
 88
88 -
 89
89 -
 90
90 -
 91
91 -
92
-
93
-
94
-
95
-
96
-
97
-
98
-
99
-
100
-
101
-
102
-
103
-
104
-
105
-
106
-
107
-
108
-
109
-
110
-
111
-
112
-
113
-
114
-
115
-
116
-
117
-
118
-
119
-
120
-
121
-
122
-
123
-
124
-
125
-
126
-
127
-
128
-
129
-
130
-
131
-
132
-
133
-
134
-
135
-
136
-
137
-
138
-
139
-
140
-
141
-
142
-
143
-
144
-
145
-
146
-
147
-
148
-
149
-
150
-
151
-
152
-
153
-
154
-
155
-
156
-
157
-
158
-
159
-
160
-
161
-
162
-
163
-
164
-
165
-
166
-
167
-
168
-
169
-
170
-
171
-
172
-
173
-
174
-
175
-
176
-
177
-
178
-
179
-
180
-
181
-
182
-
183
-
184
-
185
-
186
-
187
-
188
-
189
-
190
-
191
-
192
-
193
-
194
-
195
-
196
-
197
-
198
-
199
-
200
-
201
-
202
-
203
-
204
-
205
-
206
-
207
-
208
-
209
-
210
-
211
-
212
-
213
-
214
-
215
-
216
-
217
-
218
-
219
-
220
-
221
-
222
-
223
-
224
-
225
-
226
-
227
-
228
-
229
-
230
-
231
-
232
-
233
-
234
-
235
-
236
-
237
-
238
-
239
-
240
 |
 |
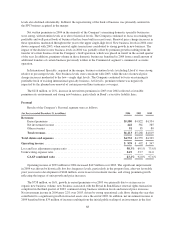
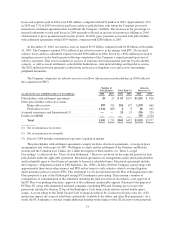
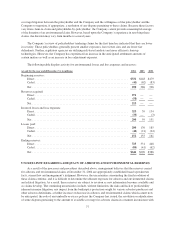
quarter of the year. Also impacting net investment income in 2004 was the effect of a decline in pretax
investment yields resulting from a higher proportion of tax-exempt investments, and generally lower yields on
fixed-income securities purchased during the year.
Claim and claim adjustment expenses in 2004 included $378 million of favorable prior-year reserve
development, primarily driven by a decline in the frequency of non-catastrophe related homeowners’ losses, as
well as an improvement in the frequency and severity trends in the automobile line of business. In 2003,
favorable prior-year reserve development totaled $212 million, also primarily due to a decline in the frequency of
non-catastrophe related homeowners’ losses. The 2003 total included a $50 million reduction in the provision for
losses resulting from the September 11, 2001 terrorist attack. In addition, claim and claim adjustment expenses in
2004 reflected the benefit of lower current accident year frequency of non-catastrophe claims in the
homeowners’ line of business than in 2003. Claims and expenses in 2004 included catastrophe losses of $189
million, compared with catastrophe losses of $249 million in 2003. The 2004 losses were primarily the result of
the four hurricanes described previously, whereas the 2003 losses resulted from a variety of storms across the
United States, including Hurricane Isabel in the third quarter of the year and wildfires in California. Claims and
expenses in 2004 also reflected continued investments in process re-engineering pilots targeted to improve loss
severity.
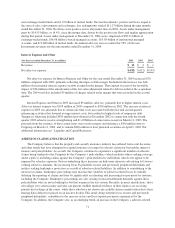
The amortization of deferred acquisition costs totaled $941 million in 2004, an 18% increase over the 2003
total of $800 million. The increase was due to higher commission and premium taxes associated with the
increases in earned premium previously described, as well as a change in product mix. General and
administrative expenses of $536 million in 2004 were 28% higher than comparable expenses of $420 million in
2003, primarily due to business growth, higher commission expense related to improved underwriting results and
investments in personnel, technology and infrastructure to support business growth and product development.
The loss and loss adjustment expense ratio in 2004 reflected a 6.8 point favorable impact from prior-year
reserve development, compared with a favorable prior-year impact of 4.4 points on the 2003 ratio. Catastrophe
losses accounted for 3.4 points and 5.2 points of the 2004 and 2003 ratios, respectively. In addition to these
factors, the significant improvement in the 2004 loss and loss adjustment expense ratio reflected the earned
impact of price increases that continued to exceed loss cost trends. The 1.2 point increase in the underwriting
expense ratio reflected the investments described previously, as well as the impact of higher commission
expenses related to improved underwriting results.
Operating income in 2003 increased $145 million, or 42%, over 2002. Operating income in 2003 benefited
from a favorable, but moderating, premium rate environment in both automobile and property, increased business
volumes and a continued moderation in the increase in loss costs.
Earned premiums increased $468 million, or 11%, in 2003, primarily due to higher rates, growth in new
business volumes and strong retention levels. Net investment income in 2003 decreased $24 million compared
with 2002, despite an increase in average invested assets resulting from strong operational cash flows. The
decline resulted from a reduction in pretax investment yields, which reflected a lower interest rate environment,
the shortening of the average effective duration of the fixed maturity portfolio, a higher proportion of tax-exempt
investments and slightly lower returns from the Company’s private equity investments.
Claim and claim adjustment expenses in 2003 included favorable prior-year reserve development of $212
million, compared with favorable development of $30 million in 2002. The favorable development in 2003
resulted from improvement in non-catastrophe-related claim frequency for both homeowners and
non-bodily-injury automobile businesses, and a $50 million reduction in reserves related to the terrorist attack on
September 11, 2001 (also due to lower than expected claim frequency). Catastrophe losses of $249 million in
2003 were significantly higher than comparable losses of $84 million in 2002. Catastrophe losses in both years
were driven by numerous storms across the United States. Losses in 2003 also reflected the impact of Hurricane
Isabel and wildfires in California.
69