Travelers 2004 Annual Report Download - page 73
Download and view the complete annual report
Please find page 73 of the 2004 Travelers annual report below. You can navigate through the pages in the report by either clicking on the pages listed below, or by using the keyword search tool below to find specific information within the annual report.-
 1
1 -
2
-
3
-
4
-
5
-
6
-
7
-
8
-
9
-
10
-
11
-
12
-
13
-
14
-
15
-
16
-
17
-
18
-
19
-
20
-
21
-
22
-
23
-
24
-
25
-
26
-
27
-
28
-
29
-
30
-
31
-
32
-
33
-
34
-
35
-
36
-
37
-
38
-
39
-
40
-
41
-
42
-
43
-
44
-
45
-
46
-
47
-
48
-
49
-
50
-
51
-
52
-
53
-
54
-
55
-
56
-
57
-
58
-
59
-
60
-
61
-
62
-
 63
63 -
 64
64 -
 65
65 -
 66
66 -
 67
67 -
 68
68 -
 69
69 -
 70
70 -
 71
71 -
 72
72 -
 73
73 -
 74
74 -
 75
75 -
 76
76 -
 77
77 -
 78
78 -
 79
79 -
 80
80 -
 81
81 -
 82
82 -
 83
83 -
84
-
85
-
86
-
87
-
88
-
89
-
90
-
91
-
92
-
93
-
94
-
95
-
96
-
97
-
98
-
99
-
100
-
101
-
102
-
103
-
104
-
105
-
106
-
107
-
108
-
109
-
110
-
111
-
112
-
113
-
114
-
115
-
116
-
117
-
118
-
119
-
120
-
121
-
122
-
123
-
124
-
125
-
126
-
127
-
128
-
129
-
130
-
131
-
132
-
133
-
134
-
135
-
136
-
137
-
138
-
139
-
140
-
141
-
142
-
143
-
144
-
145
-
146
-
147
-
148
-
149
-
150
-
151
-
152
-
153
-
154
-
155
-
156
-
157
-
158
-
159
-
160
-
161
-
162
-
163
-
164
-
165
-
166
-
167
-
168
-
169
-
170
-
171
-
172
-
173
-
174
-
175
-
176
-
177
-
178
-
179
-
180
-
181
-
182
-
183
-
184
-
185
-
186
-
187
-
188
-
189
-
190
-
191
-
192
-
193
-
194
-
195
-
196
-
197
-
198
-
199
-
200
-
201
-
202
-
203
-
204
-
205
-
206
-
207
-
208
-
209
-
210
-
211
-
212
-
213
-
214
-
215
-
216
-
217
-
218
-
219
-
220
-
221
-
222
-
223
-
224
-
225
-
226
-
227
-
228
-
229
-
230
-
231
-
232
-
233
-
234
-
235
-
236
-
237
-
238
-
239
-
240
 |
 |
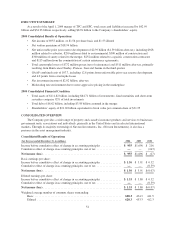
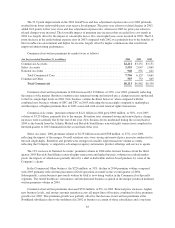
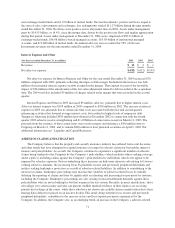
Operating income of $862 million in 2004 declined $199 million, or 19%, from 2003, which did not include
the results of SPC. Included in 2004 results were $233 million of after-tax catastrophe losses, compared with
after-tax catastrophe losses of $67 million in 2003. Also impacting 2004 operating income was net after-tax
unfavorable prior year reserve development of $802 million ($1.18 billion, pretax), primarily related to asbestos
and environmental reserve strengthening. Net after-tax unfavorable prior year reserve development totaled $439
million in 2003.
Total revenues of $11.11 billion in 2004 reflected growth of $2.12 billion in earned premiums, which was
primarily due to the merger and also reflected the earned premium effect of moderating renewal price increases
over the last twelve months in the Company’s core Commercial operations. In addition, incremental premiums
resulting from the renewal rights transaction with Royal & SunAlliance in the third quarter of 2003 contributed
to premium growth in 2004.
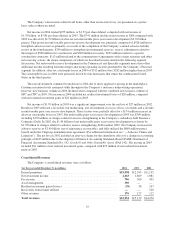
Net investment income in 2004 increased $384 million over 2003 due largely to the increase in invested
assets as a result of the merger, strong operational cash flows that contributed to the growth in invested assets
over 2003, and investment income related to the initial public trading of an investment. Also impacting net
investment income was the effect of a decline in pretax investment yields due to a higher proportion of tax-
exempt investments, and lower yields on fixed income securities and alternative investments.
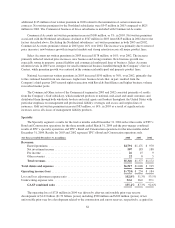
National Accounts is the primary source of fee income due to its service businesses, which include claim
and loss prevention services to large companies that choose to self-insure a portion of their insurance risks, and
claims and policy management services to workers’ compensation residual market pools, automobile assigned
risk plans and to self-insurance pools. The strong increase in 2004 fee income reflected higher new business
levels, resulting, in part, from the third quarter 2003 renewal rights transaction with Royal & SunAlliance,
renewal price increases and more workers’ compensation business being written by state residual market pools.
Claim and claim adjustment expenses in 2004 included $1.18 billion of net unfavorable prior year reserve
development in the Commercial segment, of which $927 million represented a provision to strengthen asbestos
reserves primarily as a result of the completion of the Company’s annual asbestos liability review in the fourth
quarter and $286 million represented a provision to strengthen environmental reserves. The asbestos provision
primarily resulted from an increase in litigation costs and activity surrounding peripheral defendants. With regard
to the environmental provision, new claims for hazardous waste and pollution continue to decline, though the
pace of the decrease has slowed. The average severity of claims has increased, however, leading the Company to
conclude that reserves for environmental losses needed to be increased. In June 2004, the Company decided to
commute certain reinsurance agreements with a major reinsurer, resulting in a prior year reserve charge of $38
million. Also included in net unfavorable prior-year reserve development in the Commercial segment in 2004
was a strengthening of Gulf reserves, which was more than offset by favorable prior year reserve development in
core Commercial operations due to reductions in the frequency of non-catastrophe related losses. In 2003,
unfavorable prior-year loss development in the Commercial segment totaled $676 million, the most significant
component of which was $521 million of reserve strengthening in the Gulf operations. That reserve strengthening
was primarily related to a line of business that insured the residual values of leased vehicles and that had been
placed in runoff in late 2001, and the resolution of a residual value claim dispute.
Also included in claim and claim adjustment expenses in 2004 were catastrophe losses of $358 million,
compared with catastrophe losses of $103 million in 2003. The losses in 2004 primarily resulted from the four
hurricanes that made landfall in the southeastern United States in the third quarter, whereas the 2003 losses
resulted from a variety of storms throughout the year, including Hurricane Isabel.
Other items increasing 2004 claims and expenses compared to 2003 include $72 million of charges to
increase the allowances for estimated amounts due from reinsurance recoverables and policyholders receivables,
previously described in the Consolidated Overview section.
61