Travelers 2004 Annual Report Download - page 39
Download and view the complete annual report
Please find page 39 of the 2004 Travelers annual report below. You can navigate through the pages in the report by either clicking on the pages listed below, or by using the keyword search tool below to find specific information within the annual report.-
 1
1 -
2
-
3
-
4
-
5
-
6
-
7
-
8
-
9
-
10
-
11
-
12
-
13
-
14
-
15
-
16
-
17
-
18
-
19
-
20
-
21
-
22
-
23
-
24
-
25
-
26
-
27
-
28
-
 29
29 -
 30
30 -
 31
31 -
 32
32 -
 33
33 -
 34
34 -
 35
35 -
 36
36 -
 37
37 -
 38
38 -
 39
39 -
 40
40 -
 41
41 -
 42
42 -
 43
43 -
 44
44 -
 45
45 -
 46
46 -
 47
47 -
 48
48 -
 49
49 -
50
-
51
-
52
-
53
-
54
-
55
-
56
-
57
-
58
-
59
-
60
-
61
-
62
-
63
-
64
-
65
-
66
-
67
-
68
-
69
-
70
-
71
-
72
-
73
-
74
-
75
-
76
-
77
-
78
-
79
-
80
-
81
-
82
-
83
-
84
-
85
-
86
-
87
-
88
-
89
-
90
-
91
-
92
-
93
-
94
-
95
-
96
-
97
-
98
-
99
-
100
-
101
-
102
-
103
-
104
-
105
-
106
-
107
-
108
-
109
-
110
-
111
-
112
-
113
-
114
-
115
-
116
-
117
-
118
-
119
-
120
-
121
-
122
-
123
-
124
-
125
-
126
-
127
-
128
-
129
-
130
-
131
-
132
-
133
-
134
-
135
-
136
-
137
-
138
-
139
-
140
-
141
-
142
-
143
-
144
-
145
-
146
-
147
-
148
-
149
-
150
-
151
-
152
-
153
-
154
-
155
-
156
-
157
-
158
-
159
-
160
-
161
-
162
-
163
-
164
-
165
-
166
-
167
-
168
-
169
-
170
-
171
-
172
-
173
-
174
-
175
-
176
-
177
-
178
-
179
-
180
-
181
-
182
-
183
-
184
-
185
-
186
-
187
-
188
-
189
-
190
-
191
-
192
-
193
-
194
-
195
-
196
-
197
-
198
-
199
-
200
-
201
-
202
-
203
-
204
-
205
-
206
-
207
-
208
-
209
-
210
-
211
-
212
-
213
-
214
-
215
-
216
-
217
-
218
-
219
-
220
-
221
-
222
-
223
-
224
-
225
-
226
-
227
-
228
-
229
-
230
-
231
-
232
-
233
-
234
-
235
-
236
-
237
-
238
-
239
-
240
 |
 |

(c) The Gulf Insurance Group consists of Gulf Insurance Company and its subsidiaries, Gulf Underwriters
Insurance Company, Select Insurance Company and Atlantic Insurance Company. Gulf Insurance Company
reinsures 100% of the business of these subsidiaries. Gulf Insurance Company’s direct and assumed
insurance liabilities are guaranteed by The Travelers Indemnity Company.
(d) The Northland Pool consists of Northland Insurance Company, Northfield Insurance Company, Northland
Casualty Company, Mendota Insurance Company, Mendakota Insurance Company, American Equity
Insurance Company and American Equity Specialty Insurance Company.
INVESTMENTS
Insurance company investments must comply with applicable laws and regulations which prescribe the kind,
quality and concentration of investments. In general, these laws and regulations permit investments in federal,
state and municipal obligations, corporate bonds, preferred and common equity securities, mortgage loans, real
estate and certain other investments, subject to specified limits and certain other qualifications.
At December 31, 2004, the carrying value of the Company’s investment portfolio was $64.71 billion, of
which 92% was invested in fixed maturity investments and short-term investments (of which 55% was invested
in federal, state or municipal government obligations), 1% in mortgage loans and real estate, 1% in common
stocks and other equity securities and 6% in other investments. The average duration of the fixed maturity
portfolio, including short-term investments, was 4.1 years at December 31, 2004. Non-investment grade
securities totaled approximately $1.78 billion, representing approximately 3% of the Company’s fixed maturity
investment portfolio as of December 31, 2004.
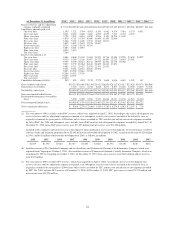
The following table sets forth information regarding the Company’s investments. It reflects the average
amount of investments, net investment income earned and the yield thereon. See note 6 of notes to the
Company’s consolidated financial statements for information regarding the Company’s investment portfolio.
(for the year ended December 31, in millions) 2004 2003 2002
Average investments (a) .............................................. $55,334 $35,306 $32,505
Net investment income ............................................... $ 2,663 $ 1,869 $ 1,881
Average pretax yield (b) .............................................. 4.8% 5.3% 6.0%
Average pretax equivalent yield (b) ..................................... 5.6% 6.2% 6.8%
Average aftertax yield (b) ............................................ 3.7% 4.0% 4.4%
(a) Reduced by payables for securities lending and repurchase agreements, and adjusted for the impact of
unrealized investment gains and losses, receivables for investment sales and payables on investment
purchases.
(b) Excluding net realized and unrealized investment gains and losses.
DERIVATIVES
See note 16 of notes to the Company’s consolidated financial statements for a discussion of the policies and
transactions related to the Company’s derivative financial instruments.
COMPETITION
The property and casualty insurance industry is highly competitive in the areas of price, service, product
offerings, agent relationships and method of distribution, i.e., use of independent agents, exclusive agents and/or
salaried employees. According to A.M. Best, there are approximately 950 property casualty organizations in the
United States, comprising approximately 2,400 property casualty companies. Of those organizations, the top 150
accounted for approximately 92% of the consolidated industry’s total net written premiums in 2003. Several
property and casualty insurers writing commercial lines of business, including the Company, offer products for
alternative forms of risk protection in addition to traditional insurance products. These products, including large
deductible programs and various forms of self-insurance that utilize captive insurance companies and risk
retention groups, have been instituted in reaction to the escalating cost of insurance caused in part by increased
costs from workers’ compensation cases and jury awards in third-party liability cases.
27