Travelers 2004 Annual Report Download - page 79
Download and view the complete annual report
Please find page 79 of the 2004 Travelers annual report below. You can navigate through the pages in the report by either clicking on the pages listed below, or by using the keyword search tool below to find specific information within the annual report.-
 1
1 -
2
-
3
-
4
-
5
-
6
-
7
-
8
-
9
-
10
-
11
-
12
-
13
-
14
-
15
-
16
-
17
-
18
-
19
-
20
-
21
-
22
-
23
-
24
-
25
-
26
-
27
-
28
-
29
-
30
-
31
-
32
-
33
-
34
-
35
-
36
-
37
-
38
-
39
-
40
-
41
-
42
-
43
-
44
-
45
-
46
-
47
-
48
-
49
-
50
-
51
-
52
-
53
-
54
-
55
-
56
-
57
-
58
-
59
-
60
-
61
-
62
-
63
-
64
-
65
-
66
-
67
-
68
-
 69
69 -
 70
70 -
 71
71 -
 72
72 -
 73
73 -
 74
74 -
 75
75 -
 76
76 -
 77
77 -
 78
78 -
 79
79 -
 80
80 -
 81
81 -
 82
82 -
 83
83 -
 84
84 -
 85
85 -
 86
86 -
 87
87 -
 88
88 -
 89
89 -
90
-
91
-
92
-
93
-
94
-
95
-
96
-
97
-
98
-
99
-
100
-
101
-
102
-
103
-
104
-
105
-
106
-
107
-
108
-
109
-
110
-
111
-
112
-
113
-
114
-
115
-
116
-
117
-
118
-
119
-
120
-
121
-
122
-
123
-
124
-
125
-
126
-
127
-
128
-
129
-
130
-
131
-
132
-
133
-
134
-
135
-
136
-
137
-
138
-
139
-
140
-
141
-
142
-
143
-
144
-
145
-
146
-
147
-
148
-
149
-
150
-
151
-
152
-
153
-
154
-
155
-
156
-
157
-
158
-
159
-
160
-
161
-
162
-
163
-
164
-
165
-
166
-
167
-
168
-
169
-
170
-
171
-
172
-
173
-
174
-
175
-
176
-
177
-
178
-
179
-
180
-
181
-
182
-
183
-
184
-
185
-
186
-
187
-
188
-
189
-
190
-
191
-
192
-
193
-
194
-
195
-
196
-
197
-
198
-
199
-
200
-
201
-
202
-
203
-
204
-
205
-
206
-
207
-
208
-
209
-
210
-
211
-
212
-
213
-
214
-
215
-
216
-
217
-
218
-
219
-
220
-
221
-
222
-
223
-
224
-
225
-
226
-
227
-
228
-
229
-
230
-
231
-
232
-
233
-
234
-
235
-
236
-
237
-
238
-
239
-
240
 |
 |

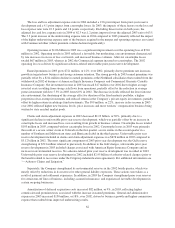
costs, additional completion costs, including costs associated with replacing the contractor, receivable discounts,
current and future claims from owners and subcontractors against the contractor, and the value of collateral,
among others.
Also during the last half of the second quarter of 2004, a participating co-surety on this exposure announced
that insurance regulators had approved its submitted run-off plan. Based upon industry’s knowledge of the co-
surety’s run-off plan and the Company’s analysis of its financial condition, the Company concluded that it was
unlikely to collect the full amount projected to be owed by the co-surety and established an appropriate level of
reserves.
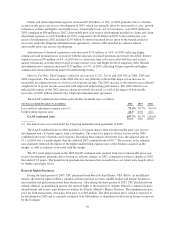
Claim and claim adjustment expenses in 2004 included $225 million of catastrophe losses, compared with
no such losses in 2003. Results in 2004 also reflected increased current year loss provisions on portions of the
Bond and Construction books of business, and $150 million of unfavorable prior year reserve development
recorded in TPC’s Construction operation prior to the merger. Excluding the impact of catastrophes, the majority
of the remaining markets comprising this segment recorded strong underwriting results, driven by favorable
current year loss experience.
Other items increasing 2004 claims and expenses compared to 2003 include $224 million of charges to
increase the allowances for estimated amounts due from reinsurance recoverables, policyholders receivables, and
a co-surety on a specific construction contractor claim previously described in the Consolidated Overview
section.
The combined ratio in 2004 included a 33.1 point impact of unfavorable prior year reserve development and
a 4.8 impact of catastrophe losses. The impact of both items in 2003 was negligible.
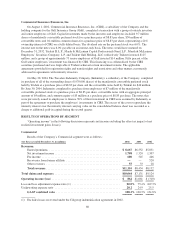
The $50 million increase in operating earnings in 2003 over 2002 reflected strong results from the
Company’s Bond operation. The $201 million, or 21%, increase in earned premiums over 2002 primarily
resulted from premium rate increases, growth in targeted new business and strong customer retention. The $5
million decline in net investment income in 2003 primarily reflected a reduction in pretax investment yields from
6.0% in 2002 to 5.3% in 2003.
Claims and expenses in 2003 included unfavorable prior year reserve development totaling $12 million,
compared with unfavorable development of $3 million in 2002.
The 5.3 point improvement in the combined ratio in 2003 reflected the impact of price increases, higher new
business volumes and controlled expense growth.
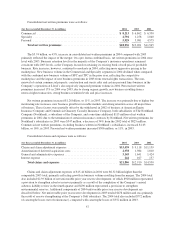
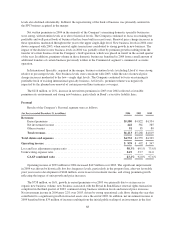
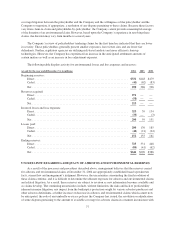
Specialty net written premiums by market were as follows:
(for the year ended December 31, in millions) 2004 2003 2002
Bond ................................................................ $1,136 $ 781 $ 630
Construction .......................................................... 846 474 408
Financial and Professional Services ........................................ 631 ——
Other ................................................................ 1,287 ——
Total Domestic Specialty ............................................ 3,900 1,255 1,038
International Specialty .................................................. 894 32
Total Specialty ................................................... $4,794 $1,258 $1,040
The $3.54 billion increase in net written premium volume over 2003 reflected the impact of the merger.
However, the repositioning of the Bond and Construction books of business primarily accounted for a decline in
net written premium volume in 2004 compared with the 2003 combined premium volume of SPC and TPC. In
Construction, that repositioning resulted in reduced retention levels when compared with 2003, and new business
67