Travelers 2004 Annual Report Download - page 212
Download and view the complete annual report
Please find page 212 of the 2004 Travelers annual report below. You can navigate through the pages in the report by either clicking on the pages listed below, or by using the keyword search tool below to find specific information within the annual report.-
 1
1 -
2
-
3
-
4
-
5
-
6
-
7
-
8
-
9
-
10
-
11
-
12
-
13
-
14
-
15
-
16
-
17
-
18
-
19
-
20
-
21
-
22
-
23
-
24
-
25
-
26
-
27
-
28
-
29
-
30
-
31
-
32
-
33
-
34
-
35
-
36
-
37
-
38
-
39
-
40
-
41
-
42
-
43
-
44
-
45
-
46
-
47
-
48
-
49
-
50
-
51
-
52
-
53
-
54
-
55
-
56
-
57
-
58
-
59
-
60
-
61
-
62
-
63
-
64
-
65
-
66
-
67
-
68
-
69
-
70
-
71
-
72
-
73
-
74
-
75
-
76
-
77
-
78
-
79
-
80
-
81
-
82
-
83
-
84
-
85
-
86
-
87
-
88
-
89
-
90
-
91
-
92
-
93
-
94
-
95
-
96
-
97
-
98
-
99
-
100
-
101
-
102
-
103
-
104
-
105
-
106
-
107
-
108
-
109
-
110
-
111
-
112
-
113
-
114
-
115
-
116
-
117
-
118
-
119
-
120
-
121
-
122
-
123
-
124
-
125
-
126
-
127
-
128
-
129
-
130
-
131
-
132
-
133
-
134
-
135
-
136
-
137
-
138
-
139
-
140
-
141
-
142
-
143
-
144
-
145
-
146
-
147
-
148
-
149
-
150
-
151
-
152
-
153
-
154
-
155
-
156
-
157
-
158
-
159
-
160
-
161
-
162
-
163
-
164
-
165
-
166
-
167
-
168
-
169
-
170
-
171
-
172
-
173
-
174
-
175
-
176
-
177
-
178
-
179
-
180
-
181
-
182
-
183
-
184
-
185
-
186
-
187
-
188
-
189
-
190
-
191
-
192
-
193
-
194
-
195
-
196
-
197
-
198
-
199
-
200
-
201
-
 202
202 -
 203
203 -
 204
204 -
 205
205 -
 206
206 -
 207
207 -
 208
208 -
 209
209 -
 210
210 -
 211
211 -
 212
212 -
 213
213 -
 214
214 -
 215
215 -
 216
216 -
 217
217 -
 218
218 -
 219
219 -
 220
220 -
 221
221 -
 222
222 -
223
-
224
-
225
-
226
-
227
-
228
-
229
-
230
-
231
-
232
-
233
-
234
-
235
-
236
-
237
-
238
-
239
-
240
 |
 |

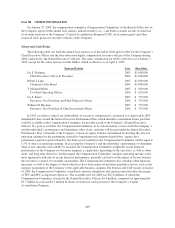
Item 9B. OTHER INFORMATION
On January 25, 2005, the compensation committee (Compensation Committee) of the Board of Directors of
the Company approved the annual base salaries, annual incentive (i.e., cash bonus) awards, awards of restricted
stock made pursuant to the Company’s Capital Accumulation Program (CAP), stock option grants and other
restricted stock grants for executive officers of the Company.
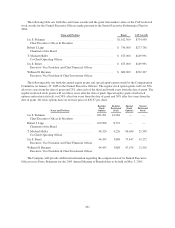
Salary and Cash Bonus
The following table sets forth the annual base salaries as of the end of 2004 and for 2005 for the Company’s
Chief Executive Officer and the four other most highly compensated executive officers of the Company during
2004 (collectively, the Named Executive Officers). The salary information for 2005 is effective as of January 1,
2005, except for the salary increase for Mr. Miller, which is effective as of April 1, 2005.
Name and Position Year Base Salary
Jay S. Fishman .................................................... 2005 $1,000,000
Chief Executive Officer & President 2004 $1,000,000
Robert I. Lipp .................................................... 2005 $1,000,000
Chairman of the Board 2004 $1,000,000
T. Michael Miller ................................................. 2005 $ 650,000
Co-Chief Operating Officer 2004 $ 625,000
Jay S. Benet ...................................................... 2005 $ 575,000
Executive Vice President and Chief Financial Officer 2004 $ 575,000
William H. Heyman ............................................... 2005 $ 575,000
Executive Vice President & Chief Investment Officer 2004 $ 575,000
In 2002, in order to achieve tax deductibility of executive compensation, a proposal was approved by SPC
shareholders that created the Senior Executive Performance Plan, which identifies a maximum bonus pool that
could be available to the Compensation Committee for possible award to the Company’s Named Executive
Officers. If a pool is available, the Compensation Committee, in its sole discretion, reviews both the Company’s
and the individual’s performance and determines what, if any, amounts will be paid under the Senior Executive
Performance Plan. Generally, if the Company’s return on equity (which is determined by dividing the after-tax
operating earnings for the performance period by beginning total common shareholders’ equity) for a
performance period is greater than 8%, the bonus pool available to the Compensation Committee will be equal to
1.5% of after-tax operating earnings. In assessing the Company’s and the individual’s performance to determine
what, if any, amounts will actually be awarded, the Compensation Committee weighs the recent financial
performance of the Company or a business segment, as applicable, depending on the executive, as well as other
short- and long-term objectives. In this regard, the Compensation Committee considers operating income as the
most appropriate indicator of recent financial performance, generally exclusive of the impact of factors beyond
the executive’s control, for example catastrophes. The Compensation Committee also considers other financial
measures, as well as the degree to which objectives have been achieved and other qualitative factors, such as the
strategic positioning of the Company or the applicable business segment. For bonuses and CAP awards in respect
of 2004, the Compensation Committee considered corporate integration and expense reduction after the merger
of TPC and SPC as important objectives. The available pool for 2004 was $27.6 million, of which the
Compensation Committee awarded to the Named Executive Officers $5.0 million, comprised of approximately
$3.7 million in cash and $1.3 million in shares of restricted stock pursuant to the Company’s Capital
Accumulation Program.
200