Travelers 2004 Annual Report Download - page 34
Download and view the complete annual report
Please find page 34 of the 2004 Travelers annual report below. You can navigate through the pages in the report by either clicking on the pages listed below, or by using the keyword search tool below to find specific information within the annual report.-
 1
1 -
2
-
3
-
4
-
5
-
6
-
7
-
8
-
9
-
10
-
11
-
12
-
13
-
14
-
15
-
16
-
17
-
18
-
19
-
20
-
21
-
22
-
23
-
 24
24 -
 25
25 -
 26
26 -
 27
27 -
 28
28 -
 29
29 -
 30
30 -
 31
31 -
 32
32 -
 33
33 -
 34
34 -
 35
35 -
 36
36 -
 37
37 -
 38
38 -
 39
39 -
 40
40 -
 41
41 -
 42
42 -
 43
43 -
 44
44 -
45
-
46
-
47
-
48
-
49
-
50
-
51
-
52
-
53
-
54
-
55
-
56
-
57
-
58
-
59
-
60
-
61
-
62
-
63
-
64
-
65
-
66
-
67
-
68
-
69
-
70
-
71
-
72
-
73
-
74
-
75
-
76
-
77
-
78
-
79
-
80
-
81
-
82
-
83
-
84
-
85
-
86
-
87
-
88
-
89
-
90
-
91
-
92
-
93
-
94
-
95
-
96
-
97
-
98
-
99
-
100
-
101
-
102
-
103
-
104
-
105
-
106
-
107
-
108
-
109
-
110
-
111
-
112
-
113
-
114
-
115
-
116
-
117
-
118
-
119
-
120
-
121
-
122
-
123
-
124
-
125
-
126
-
127
-
128
-
129
-
130
-
131
-
132
-
133
-
134
-
135
-
136
-
137
-
138
-
139
-
140
-
141
-
142
-
143
-
144
-
145
-
146
-
147
-
148
-
149
-
150
-
151
-
152
-
153
-
154
-
155
-
156
-
157
-
158
-
159
-
160
-
161
-
162
-
163
-
164
-
165
-
166
-
167
-
168
-
169
-
170
-
171
-
172
-
173
-
174
-
175
-
176
-
177
-
178
-
179
-
180
-
181
-
182
-
183
-
184
-
185
-
186
-
187
-
188
-
189
-
190
-
191
-
192
-
193
-
194
-
195
-
196
-
197
-
198
-
199
-
200
-
201
-
202
-
203
-
204
-
205
-
206
-
207
-
208
-
209
-
210
-
211
-
212
-
213
-
214
-
215
-
216
-
217
-
218
-
219
-
220
-
221
-
222
-
223
-
224
-
225
-
226
-
227
-
228
-
229
-
230
-
231
-
232
-
233
-
234
-
235
-
236
-
237
-
238
-
239
-
240
 |
 |

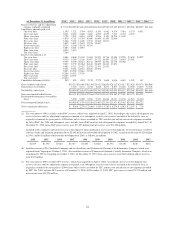
(at December 31, in millions) 1994(a) 1995(a) 1996(a) 1997(a) 1998(a) 1999(a) 2000(a) 2001(a)(b) 2002(a)(b) 2003(a)(b)2004(a)(b)(c)
Reserves for loss and loss adjustment
expense originally estimated ........$ 9,712 $10,090 $21,816 $21,406 $20,763 $19,983 $19,435 $20,197 $23,268 $24,055 $41,446
Cumulative amounts paid as of
One year later .................... 1,595 1,521 3,704 4,025 4,159 4,082 4,374 5,018 5,170 4,651
Two years later ................... 2,631 2,809 6,600 6,882 6,879 6,957 7,517 8,745 8,319
Three years later .................. 3,798 3,903 8,841 8,850 9,006 9,324 10,218 11,149
Four years later ................... 4,676 4,761 10,355 10,480 10,809 11,493 12,000
Five years later ................... 5,388 5,322 11,649 11,915 12,565 12,911
Six years later .................... 5,855 5,842 12,893 13,376 13,647
Seven years later ................. 6,324 6,146 14,154 14,306
Eight years later .................. 6,485 6,668 14,987
Nine years later .................. 6,954 7,013
Ten years later ................... 7,280
Reserves reestimated as of
One year later .................... 9,486 9,848 21,345 21,083 20,521 19,736 19,394 23,228 23,658 24,222
Two years later ................... 9,310 9,785 21,160 20,697 20,172 19,600 22,233 24,083 24,592
Three years later .................. 9,395 9,789 20,816 20,417 19,975 22,302 22,778 25,062
Four years later ................... 9,427 9,735 20,664 20,168 22,489 22,612 23,871
Five years later ................... 9,463 9,711 20,427 22,570 22,593 23,591
Six years later .................... 9,441 9,661 22,851 22,625 23,492
Seven years later ................. 9,445 10,562 22,861 23,530
Eight years later .................. 10,286 10,553 23,759
Nine years later .................. 10,265 10,945
Ten years later ................... 10,654
Cumulative deficiency(a)(b)(c) ........ 942 855 1,943 2,124 2,729 3,608 4,436 4,865 1,324 167
Gross liability–end of year ............ $15,213 $30,969 $30,138 $29,411 $28,854 $28,312 $30,617 $33,628 $34,474 $58,984
Reinsurance recoverables ............. 5,123 9,153 8,732 8,648 8,871 8,877 10,420 10,360 10,419 17,538
Net liability–end of year ............. $10,090 $21,816 $21,406 $20,763 $19,983 $19,435 $20,197 $23,268 $24,055 $41,446
Gross reestimated liability-latest ....... $16,151 $33,248 $32,586 $32,825 $33,637 $34,582 $37,200 $36,175 $35,252
Reestimated reinsurance recoverables-
latest ........................... 5,206 9,489 9,056 9,333 10,046 10,711 12,138 11,583 11,030
Net reestimated liability-latest ......... $10,945 $23,759 $23,530 $23,492 $23,591 $23,871 $25,062 $24,592 $24,222
Gross cumulative deficiency .......... $ 938$ 2,279 $ 2,448 $ 3,414 $ 4,783 $ 6,270 $ 6,583 $ 2,547 $ 778
(a) For years prior to 1996, excludes Aetna P&C reserves, which were acquired on April 2, 1996. Accordingly, the reserve development (net
reserves for loss and loss adjustment expense reestimated as of subsequent years less net reserves recorded at the end of the year, as
originally estimated) for years prior to 1996 relates only to losses recorded by TPC and does not include reserve development recorded
by Aetna P&C. For 1996 and subsequent years, includes Aetna P&C reserves and subsequent development recorded by Aetna P&C. At
December 31, 1996 Aetna P&C gross reserves were $15,555 million and net reserves were $11,608 million.
Included in the cumulative deficiency by year is the impact of unfavorable prior year reserve development, net of reinsurance, related to
asbestos claims and litigation, primarily due to $2,945 million of unfavorable development in 2002, accretion of discount of $24 million
in 2003, and $416 million of unfavorable development in 2004, as follows, in millions:
1994 1995 1996 1997 1998 1999 2000 2001 2002 2003
$1,839 $1,796 $3,816 $3,747 $3,681 $3,624 $3,574 $3,385 $440 $416
(b) Includes reserves of The Northland Company and its subsidiaries and Commercial Guaranty Lloyds Insurance Company which were
acquired from Citigroup on October 1, 2001. Also includes reserves of Commercial Guaranty Casualty Insurance Company, which was
contributed to TPC by Citigroup on October 3, 2001. At December 31, 2001, these gross reserves were $867 million and net reserves
were $633 million.
(c) For years prior to 2004, excludes SPC reserves, which were acquired on April 1, 2004. Accordingly, the reserve development (net
reserves for loss and loss adjustment expense reestimated as of subsequent years less net reserves recorded at the end of the year, as
originally estimated) for years prior to 2004 relates only to losses recorded by TPC and does not include reserve development recorded
by SPC. For 2004, includes SPC reserves at December 31, 2004. At December 31, 2004, SPC gross reserves were $23,274 million and
net reserves were $15,959 million.
22