Travelers 2004 Annual Report Download - page 91
Download and view the complete annual report
Please find page 91 of the 2004 Travelers annual report below. You can navigate through the pages in the report by either clicking on the pages listed below, or by using the keyword search tool below to find specific information within the annual report.-
 1
1 -
2
-
3
-
4
-
5
-
6
-
7
-
8
-
9
-
10
-
11
-
12
-
13
-
14
-
15
-
16
-
17
-
18
-
19
-
20
-
21
-
22
-
23
-
24
-
25
-
26
-
27
-
28
-
29
-
30
-
31
-
32
-
33
-
34
-
35
-
36
-
37
-
38
-
39
-
40
-
41
-
42
-
43
-
44
-
45
-
46
-
47
-
48
-
49
-
50
-
51
-
52
-
53
-
54
-
55
-
56
-
57
-
58
-
59
-
60
-
61
-
62
-
63
-
64
-
65
-
66
-
67
-
68
-
69
-
70
-
71
-
72
-
73
-
74
-
75
-
76
-
77
-
78
-
79
-
80
-
 81
81 -
 82
82 -
 83
83 -
 84
84 -
 85
85 -
 86
86 -
 87
87 -
 88
88 -
 89
89 -
 90
90 -
 91
91 -
 92
92 -
 93
93 -
 94
94 -
 95
95 -
 96
96 -
 97
97 -
 98
98 -
 99
99 -
 100
100 -
 101
101 -
102
-
103
-
104
-
105
-
106
-
107
-
108
-
109
-
110
-
111
-
112
-
113
-
114
-
115
-
116
-
117
-
118
-
119
-
120
-
121
-
122
-
123
-
124
-
125
-
126
-
127
-
128
-
129
-
130
-
131
-
132
-
133
-
134
-
135
-
136
-
137
-
138
-
139
-
140
-
141
-
142
-
143
-
144
-
145
-
146
-
147
-
148
-
149
-
150
-
151
-
152
-
153
-
154
-
155
-
156
-
157
-
158
-
159
-
160
-
161
-
162
-
163
-
164
-
165
-
166
-
167
-
168
-
169
-
170
-
171
-
172
-
173
-
174
-
175
-
176
-
177
-
178
-
179
-
180
-
181
-
182
-
183
-
184
-
185
-
186
-
187
-
188
-
189
-
190
-
191
-
192
-
193
-
194
-
195
-
196
-
197
-
198
-
199
-
200
-
201
-
202
-
203
-
204
-
205
-
206
-
207
-
208
-
209
-
210
-
211
-
212
-
213
-
214
-
215
-
216
-
217
-
218
-
219
-
220
-
221
-
222
-
223
-
224
-
225
-
226
-
227
-
228
-
229
-
230
-
231
-
232
-
233
-
234
-
235
-
236
-
237
-
238
-
239
-
240
 |
 |

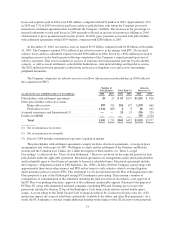
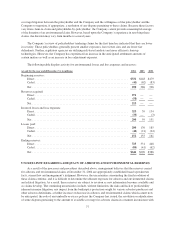
The following table sets forth the Company’s combined fixed maturity investment portfolio classified by
Moody’s Investors Service ratings:
(at December 31, 2004, in millions)
Carrying
Value
Percent of Total
Carrying Value
Quality Rating:
Aaa ................................................................ $32,656 60.2%
Aa ................................................................. 11,081 20.4
A .................................................................. 4,931 9.1
Baa ................................................................ 3,810 7.0
Total investment grade ................................................. 52,478 96.7
Non-investment grade ................................................. 1,778 3.3
Total fixed maturity investments ......................................... $54,256 100.0%
The Company makes investments in collateralized mortgage obligations (CMOs) that typically have high
credit quality, offer good liquidity, and are expected to provide an advantage in yield compared to U.S. Treasury
securities. The Company’s investment strategy is to purchase CMO tranches which offer the most favorable
return given the risks involved. One significant risk evaluated is prepayment sensitivity. While prepayment risk
(either shortening or lengthening of duration) and its effect on total return cannot be fully controlled, particularly
when interest rates move dramatically, the investment process generally favors securities that control this risk
within expected interest rate ranges. The Company does invest in other types of CMO tranches if a careful
assessment indicates a favorable risk/return tradeoff. The Company does not purchase residual interests in
CMOs.
At December 31, 2004 and 2003, the Company held CMOs classified as available for sale with a fair value
of $3.30 billion and $3.06 billion, respectively (excluding Commercial Mortgage-Backed Securities of $953
million and $875 million, respectively). Approximately 53% and 60% of the Company’s CMO holdings are
guaranteed by or fully collateralized by securities issued by GNMA, FNMA or FHLMC at December 31, 2004
and 2003, respectively. In addition, the Company held $4.66 billion and $3.80 billion of GNMA, FNMA,
FHLMC or FHA mortgage-backed pass-through securities classified as available for sale at December 31, 2004
and 2003, respectively. Virtually all of these securities are rated Aaa.
The Company’s other investments are primarily comprised of venture capital, through direct ownership and
limited partnerships, private equity limited partnerships, joint ventures, other limited partnerships and trading
securities, which are subject to more volatility than the Company’s fixed income investments, but historically
have provided a higher return. At December 31, 2004, the carrying value of the Company’s other investments
was $3.56 billion.
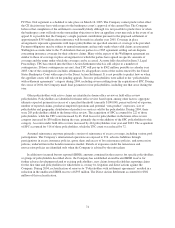
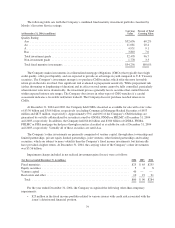
Impairment charges included in net realized investment gains (losses) were as follows:
(for the year ended December 31, in millions) 2004 2003 2002
Fixed maturities ............................................................ $25 $ 65 $255
Equity securities ............................................................ 5 6 8
Venture capital ............................................................. 40 — —
Real estate and other ......................................................... 10 19 21
Total ................................................................... $80 $ 90 $284
For the year ended December 31, 2004, the Company recognized the following other-than-temporary
impairments:
• $25 million in the fixed income portfolio related to various issuers with credit risk associated with the
issuer’s deteriorated financial position.
79