Travelers 2004 Annual Report Download - page 168
Download and view the complete annual report
Please find page 168 of the 2004 Travelers annual report below. You can navigate through the pages in the report by either clicking on the pages listed below, or by using the keyword search tool below to find specific information within the annual report.-
 1
1 -
2
-
3
-
4
-
5
-
6
-
7
-
8
-
9
-
10
-
11
-
12
-
13
-
14
-
15
-
16
-
17
-
18
-
19
-
20
-
21
-
22
-
23
-
24
-
25
-
26
-
27
-
28
-
29
-
30
-
31
-
32
-
33
-
34
-
35
-
36
-
37
-
38
-
39
-
40
-
41
-
42
-
43
-
44
-
45
-
46
-
47
-
48
-
49
-
50
-
51
-
52
-
53
-
54
-
55
-
56
-
57
-
58
-
59
-
60
-
61
-
62
-
63
-
64
-
65
-
66
-
67
-
68
-
69
-
70
-
71
-
72
-
73
-
74
-
75
-
76
-
77
-
78
-
79
-
80
-
81
-
82
-
83
-
84
-
85
-
86
-
87
-
88
-
89
-
90
-
91
-
92
-
93
-
94
-
95
-
96
-
97
-
98
-
99
-
100
-
101
-
102
-
103
-
104
-
105
-
106
-
107
-
108
-
109
-
110
-
111
-
112
-
113
-
114
-
115
-
116
-
117
-
118
-
119
-
120
-
121
-
122
-
123
-
124
-
125
-
126
-
127
-
128
-
129
-
130
-
131
-
132
-
133
-
134
-
135
-
136
-
137
-
138
-
139
-
140
-
141
-
142
-
143
-
144
-
145
-
146
-
147
-
148
-
149
-
150
-
151
-
152
-
153
-
154
-
155
-
156
-
157
-
 158
158 -
 159
159 -
 160
160 -
 161
161 -
 162
162 -
 163
163 -
 164
164 -
 165
165 -
 166
166 -
 167
167 -
 168
168 -
 169
169 -
 170
170 -
 171
171 -
 172
172 -
 173
173 -
 174
174 -
 175
175 -
 176
176 -
 177
177 -
 178
178 -
179
-
180
-
181
-
182
-
183
-
184
-
185
-
186
-
187
-
188
-
189
-
190
-
191
-
192
-
193
-
194
-
195
-
196
-
197
-
198
-
199
-
200
-
201
-
202
-
203
-
204
-
205
-
206
-
207
-
208
-
209
-
210
-
211
-
212
-
213
-
214
-
215
-
216
-
217
-
218
-
219
-
220
-
221
-
222
-
223
-
224
-
225
-
226
-
227
-
228
-
229
-
230
-
231
-
232
-
233
-
234
-
235
-
236
-
237
-
238
-
239
-
240
 |
 |
THE ST. PAUL TRAVELERS COMPANIES, INC. AND SUBSIDIARIES
NOTES TO CONSOLIDATED FINANCIAL STATEMENTS—(Continued)
9. INSURANCE CLAIMS RESERVES, Continued
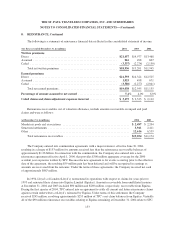
In 2002, estimated claims and claim adjustment expenses for claims arising in prior years was a net
unfavorable development of $3.03 billion. This included $3.13 billion of net unfavorable development which
impacted results of operations primarily due to unfavorable development of $2.95 billion related to asbestos.
Claims arising in prior years for 2002 also included unfavorable development of $150 million related to
environmental claims and favorable development of $100 million related to cumulative injury claims. In
addition, estimated claims and claim adjustment expenses for claims arising in prior years included net
unfavorable development, primarily related to certain Commercial coverages, predominantly in assumed
reinsurance specialty businesses, partially offset by favorable development in Commercial workers’
compensation and Personal automobile. In 2002, estimated claims and claim adjustment expenses for claims
arising in prior years included $71 million of net favorable loss development on Commercial loss sensitive
policies in various lines; however, since the business to which it relates is subject to premium adjustments, there
is no impact on results of operations.
For each of the years ended December 31, 2004, 2003 and 2002, changes in allocations between accident
years of loss adjustment expenses, pursuant to regulatory reporting requirements, are included in claims and
claim adjustment expenses for claims arising in prior years and did not impact results of operations.
The fair value adjustments to the acquired claims and claim adjustment expense reserves and reinsurance
recoverables as of April 1, 2004, the merger date, are reported as intangible assets and are being amortized over
the expected payout period of the acquired reserves. See note 2.
Asbestos and Environmental Reserves
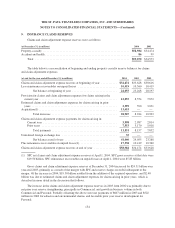
At December 31, 2004 and 2003, the Company’s claims and claim adjustment expense reserves included
$4.57 billion and $3.27 billion, respectively, for asbestos and environmental-related claims, net of reinsurance.
It is difficult to estimate the reserves for asbestos and environmental-related claims due to the vagaries of
court coverage decisions, plaintiffs’ expanded theories of liability, the risks inherent in major litigation and other
uncertainties, including without limitation, those which are set forth below.
Because each policyholder presents different liability and coverage issues, the Company generally evaluates
the asbestos exposure presented by each policyholder on a policyholder-by-policyholder basis. In the course of
this evaluation, the Company considers: available insurance coverage, including the role of any umbrella or
excess insurance the Company has issued to the policyholder; limits and deductibles; an analysis of each
policyholder’s potential liability; the jurisdictions involved; past and anticipated future claim activity and loss
development on pending claims; past settlement values of similar claims; allocated claim adjustment expense;
potential role of other insurance; the role, if any, of non-asbestos claims or potential non-asbestos claims in any
resolution process; and applicable coverage defenses or determinations, if any, including the determination as to
whether or not an asbestos claim is a products/completed operation claim subject to an aggregate limit and the
available coverage, if any, for that claim. When the gross ultimate exposure for indemnity and related claim
adjustment expense is determined for a policyholder, the Company calculates, by each policy year, a ceded
reinsurance projection based on any applicable facultative and treaty reinsurance, as well as past ceded
experience and reinsurance collections. Conventional actuarial methods are not utilized to establish asbestos
reserves. The Company’s evaluations have not resulted in any data from which a meaningful average asbestos
defense or indemnity payment may be determined.
With respect to asbestos exposures, the Company also compares its historical gross and net loss and expense
paid experience, year-by-year, to assess any emerging trends, fluctuations, or characteristics suggested by the
aggregate paid activity. Net asbestos losses and expenses paid in 2004 were $301 million, compared with $452
156