Travelers 2004 Annual Report Download - page 93
Download and view the complete annual report
Please find page 93 of the 2004 Travelers annual report below. You can navigate through the pages in the report by either clicking on the pages listed below, or by using the keyword search tool below to find specific information within the annual report.-
 1
1 -
2
-
3
-
4
-
5
-
6
-
7
-
8
-
9
-
10
-
11
-
12
-
13
-
14
-
15
-
16
-
17
-
18
-
19
-
20
-
21
-
22
-
23
-
24
-
25
-
26
-
27
-
28
-
29
-
30
-
31
-
32
-
33
-
34
-
35
-
36
-
37
-
38
-
39
-
40
-
41
-
42
-
43
-
44
-
45
-
46
-
47
-
48
-
49
-
50
-
51
-
52
-
53
-
54
-
55
-
56
-
57
-
58
-
59
-
60
-
61
-
62
-
63
-
64
-
65
-
66
-
67
-
68
-
69
-
70
-
71
-
72
-
73
-
74
-
75
-
76
-
77
-
78
-
79
-
80
-
81
-
82
-
 83
83 -
 84
84 -
 85
85 -
 86
86 -
 87
87 -
 88
88 -
 89
89 -
 90
90 -
 91
91 -
 92
92 -
 93
93 -
 94
94 -
 95
95 -
 96
96 -
 97
97 -
 98
98 -
 99
99 -
 100
100 -
 101
101 -
 102
102 -
 103
103 -
104
-
105
-
106
-
107
-
108
-
109
-
110
-
111
-
112
-
113
-
114
-
115
-
116
-
117
-
118
-
119
-
120
-
121
-
122
-
123
-
124
-
125
-
126
-
127
-
128
-
129
-
130
-
131
-
132
-
133
-
134
-
135
-
136
-
137
-
138
-
139
-
140
-
141
-
142
-
143
-
144
-
145
-
146
-
147
-
148
-
149
-
150
-
151
-
152
-
153
-
154
-
155
-
156
-
157
-
158
-
159
-
160
-
161
-
162
-
163
-
164
-
165
-
166
-
167
-
168
-
169
-
170
-
171
-
172
-
173
-
174
-
175
-
176
-
177
-
178
-
179
-
180
-
181
-
182
-
183
-
184
-
185
-
186
-
187
-
188
-
189
-
190
-
191
-
192
-
193
-
194
-
195
-
196
-
197
-
198
-
199
-
200
-
201
-
202
-
203
-
204
-
205
-
206
-
207
-
208
-
209
-
210
-
211
-
212
-
213
-
214
-
215
-
216
-
217
-
218
-
219
-
220
-
221
-
222
-
223
-
224
-
225
-
226
-
227
-
228
-
229
-
230
-
231
-
232
-
233
-
234
-
235
-
236
-
237
-
238
-
239
-
240
 |
 |

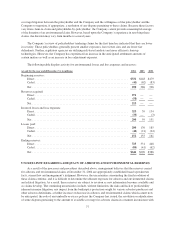
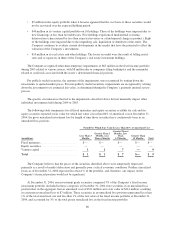
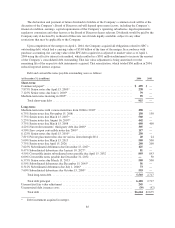
Following are the pretax realized losses on investments sold during the year ended December 31, 2004:
(in millions) Loss Fair Value
Fixed maturities .............................................................. $131 $4,264
Equity securities .............................................................. 863
Other ....................................................................... 28 230
Total ....................................................................... $167 $4,557
Resulting purchases and sales of investments are based on cash requirements, the characteristics of the
insurance liabilities and current market conditions. The Company identifies investments to be sold to achieve its
primary investment goals of assuring the Company’s ability to meet policyholder obligations as well as to
optimize investment returns, given these obligations.
OUTLOOK
The Company’s strategic objective is to enhance its position as a consistently profitable market leader and a
cost-effective provider of property and casualty insurance in the United States. A variety of factors continue to
affect the property and casualty insurance market and the Company’s core business outlook for 2005, including
the moderating level of price increases in the commercial marketplace, the increasing competitive environment
across all of the Company’s businesses, loss cost trends (including medical inflation and auto loss costs),
asbestos-related developments and rising reinsurance and litigation costs.
The Company expects market conditions in the property casualty insurance sector to continue to be quite
competitive throughout 2005. Commercial pricing at the end of 2004 had declined to the low single-digit range
and may turn negative in 2005 for certain products in some markets. In general, the pricing environment in the
Specialty segment is expected to be better than in Commercial, largely due to the specialized nature of the
Specialty businesses. Within Personal, the Company expects to see increased price competition in the auto
segment, while the homeowners segment is expected to remain stable.
The industry has experienced unprecedented low levels of claim frequency over the last several years, a
trend that is not expected to change materially in 2005. Severity trend, the other component of loss trend, is
expected to continue to remain stable. Nevertheless, with continued pressure on pricing, it is likely that margins
will contract in certain parts of the Company’s business in 2005, albeit from very strong levels.
Changes in the general interest rate environment affect the returns available on new investments. While a
rising interest rate environment enhances the returns available on new fixed income investments, it reduces the
market value of existing fixed maturity investments and the availability of gains on disposition. A decline in
interest rates reduces the returns available on new investments but increases the market value of existing
investments and the availability of realized investment gains on disposition. In 2004, interest rates began to
increase after reaching their lowest levels since the 1950’s in 2003. Consequently, yields available on new
investments began to grow, but remained below the existing portfolio’s average book yield. The continuation of
an upward trend in interest rates in 2005 would favorably impact the average book yield of the Company’s fixed
income holdings.
In January 2005, the Company announced that it will explore strategic alternatives to divest its majority
ownership position in Nuveen Investments, thereby providing the Company with the opportunity to increase its
financial flexibility.
The Company expects to realize its targeted merger-related cumulative expense savings of $350 million by
the end of 2005 and $450 million by the end of 2006. A portion of these savings are expected be redeployed to
support growth in the Company’s business segments and investments in technology.
81