Travelers 2004 Annual Report Download - page 74
Download and view the complete annual report
Please find page 74 of the 2004 Travelers annual report below. You can navigate through the pages in the report by either clicking on the pages listed below, or by using the keyword search tool below to find specific information within the annual report.-
 1
1 -
2
-
3
-
4
-
5
-
6
-
7
-
8
-
9
-
10
-
11
-
12
-
13
-
14
-
15
-
16
-
17
-
18
-
19
-
20
-
21
-
22
-
23
-
24
-
25
-
26
-
27
-
28
-
29
-
30
-
31
-
32
-
33
-
34
-
35
-
36
-
37
-
38
-
39
-
40
-
41
-
42
-
43
-
44
-
45
-
46
-
47
-
48
-
49
-
50
-
51
-
52
-
53
-
54
-
55
-
56
-
57
-
58
-
59
-
60
-
61
-
62
-
63
-
 64
64 -
 65
65 -
 66
66 -
 67
67 -
 68
68 -
 69
69 -
 70
70 -
 71
71 -
 72
72 -
 73
73 -
 74
74 -
 75
75 -
 76
76 -
 77
77 -
 78
78 -
 79
79 -
 80
80 -
 81
81 -
 82
82 -
 83
83 -
 84
84 -
85
-
86
-
87
-
88
-
89
-
90
-
91
-
92
-
93
-
94
-
95
-
96
-
97
-
98
-
99
-
100
-
101
-
102
-
103
-
104
-
105
-
106
-
107
-
108
-
109
-
110
-
111
-
112
-
113
-
114
-
115
-
116
-
117
-
118
-
119
-
120
-
121
-
122
-
123
-
124
-
125
-
126
-
127
-
128
-
129
-
130
-
131
-
132
-
133
-
134
-
135
-
136
-
137
-
138
-
139
-
140
-
141
-
142
-
143
-
144
-
145
-
146
-
147
-
148
-
149
-
150
-
151
-
152
-
153
-
154
-
155
-
156
-
157
-
158
-
159
-
160
-
161
-
162
-
163
-
164
-
165
-
166
-
167
-
168
-
169
-
170
-
171
-
172
-
173
-
174
-
175
-
176
-
177
-
178
-
179
-
180
-
181
-
182
-
183
-
184
-
185
-
186
-
187
-
188
-
189
-
190
-
191
-
192
-
193
-
194
-
195
-
196
-
197
-
198
-
199
-
200
-
201
-
202
-
203
-
204
-
205
-
206
-
207
-
208
-
209
-
210
-
211
-
212
-
213
-
214
-
215
-
216
-
217
-
218
-
219
-
220
-
221
-
222
-
223
-
224
-
225
-
226
-
227
-
228
-
229
-
230
-
231
-
232
-
233
-
234
-
235
-
236
-
237
-
238
-
239
-
240
 |
 |
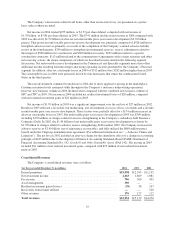
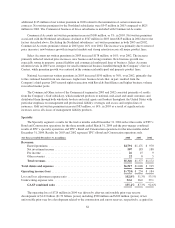
The loss and loss adjustment expense ratio in 2004 included a 13.6 point impact from prior-year reserve
development and a 4.1 point impact from catastrophe losses. In 2003, the impacts of these factors on the loss and
loss expense ratio were 10.3 points and 1.6 points, respectively. Excluding those factors in both years, the
adjusted loss and loss expense ratio in 2004 of 62.3 was 1.2 points improved over the adjusted 2003 ratio of 63.5.
The 3.3 point increase in the underwriting expense ratio in 2004 compared to 2003 primarily reflected the impact
of the higher underwriting expense ratio of the business acquired in the merger and operating expenses associated
with Commercial other (where premium volume declined significantly).
Operating income of $1.06 billion in 2003 was a significant improvement over the operating loss of $310
million in 2002. Operating results in 2003 reflected a favorable, but moderating, rate environment characterized
by rate increases in excess of loss cost trends, and increased business volumes. After-tax catastrophe losses
totaled $67 million in 2003, whereas in 2002 the Commercial segment incurred no catastrophes. The 2002
operating loss was driven by significant asbestos-related unfavorable prior-year reserve development.
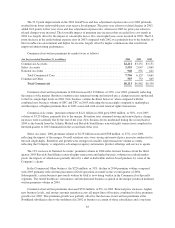
Earned premiums in 2003 grew $721 million, or 12%, over 2002, primarily due to premium rate increases,
growth in targeted new business and strong customer retention. The strong growth in 2003 earned premiums was
partially offset by a $214 million decline in earned premiums at the Northland subsidiaries that resulted from the
withdrawal in 2002 of business at American Equity Insurance Company and Commercial Guaranty Casualty
Insurance Company. Net investment income in 2003 increased $17 million over 2002 due to higher average
invested assets resulting from strong cash flows from operations, partially offset by the reduction in average
pretax investment yields to 5.3% in 2003 from 6.0% in 2002. The decrease in yields reflected the lower interest
rate environment, the shortening of the average effective duration of the fixed maturity portfolio, a higher
proportion of tax-exempt investments and reduced returns in the Company’s private equity investments; partially
offset by higher returns in arbitrage fund investments. The $99 million, or 22%, increase in fee income in 2003
over 2002 reflected higher new business levels, price increases and more workers’ compensation business being
written by state residual market pools.
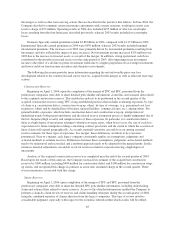
Claims and claim adjustment expenses in 2003 decreased $2.23 billion, or 30%, primarily due to a
significant decline in unfavorable prior year reserve development, which was partially offset by an increase in
catastrophe losses and increased loss costs resulting from growth in business volume. Catastrophe losses totaled
$103 million in 2003, compared with no catastrophe losses in 2002. Catastrophe losses in 2003 were primarily
the result of a severe winter storm in Colorado in the first quarter, severe storms in the second quarter in a
number of Southern and Midwestern states and Hurricane Isabel in the third quarter. Unfavorable prior year
reserve development included in claims and claim adjustment expenses was $676 million in 2003 compared to
$3.12 billion in 2002. The most significant component of 2003 prior year development was the Gulf reserve
strengthening of $521 million referred to previously. In addition to the Gulf charges, unfavorable prior-year
reserve development in 2003 included charges associated with American Equity Insurance Company and an
increase in environmental reserves. No asbestos-related prior year reserve development was recorded in 2003.
Unfavorable prior year reserve development in 2002 included $2.95 billion of asbestos-related charges (prior to
the benefit related to recoveries under the Citigroup indemnification agreement). For additional information see
“—Asbestos Claims and Litigation.”
Separately, the Company strengthened its environmental reserves in the 2002 fourth quarter, which was
mostly offset by reductions in its reserves for other general liability exposures. These actions were taken as a
result of payment and settlement experience. In addition, in 2003 the Company strengthened prior year reserves
for certain run-off lines of business, including assumed reinsurance, and experienced favorable development in
certain on-going businesses.
Amortization of deferred acquisition costs increased $82 million, or 9%, in 2003, reflecting higher
commission and premium taxes associated with the increase in earned premiums. General and administrative
expenses in 2003 increased $150 million, or 18%, over 2002, driven by business growth and higher commission
expense that resulted from improved underwriting results.
62