Travelers 2004 Annual Report Download - page 227
Download and view the complete annual report
Please find page 227 of the 2004 Travelers annual report below. You can navigate through the pages in the report by either clicking on the pages listed below, or by using the keyword search tool below to find specific information within the annual report.-
 1
1 -
2
-
3
-
4
-
5
-
6
-
7
-
8
-
9
-
10
-
11
-
12
-
13
-
14
-
15
-
16
-
17
-
18
-
19
-
20
-
21
-
22
-
23
-
24
-
25
-
26
-
27
-
28
-
29
-
30
-
31
-
32
-
33
-
34
-
35
-
36
-
37
-
38
-
39
-
40
-
41
-
42
-
43
-
44
-
45
-
46
-
47
-
48
-
49
-
50
-
51
-
52
-
53
-
54
-
55
-
56
-
57
-
58
-
59
-
60
-
61
-
62
-
63
-
64
-
65
-
66
-
67
-
68
-
69
-
70
-
71
-
72
-
73
-
74
-
75
-
76
-
77
-
78
-
79
-
80
-
81
-
82
-
83
-
84
-
85
-
86
-
87
-
88
-
89
-
90
-
91
-
92
-
93
-
94
-
95
-
96
-
97
-
98
-
99
-
100
-
101
-
102
-
103
-
104
-
105
-
106
-
107
-
108
-
109
-
110
-
111
-
112
-
113
-
114
-
115
-
116
-
117
-
118
-
119
-
120
-
121
-
122
-
123
-
124
-
125
-
126
-
127
-
128
-
129
-
130
-
131
-
132
-
133
-
134
-
135
-
136
-
137
-
138
-
139
-
140
-
141
-
142
-
143
-
144
-
145
-
146
-
147
-
148
-
149
-
150
-
151
-
152
-
153
-
154
-
155
-
156
-
157
-
158
-
159
-
160
-
161
-
162
-
163
-
164
-
165
-
166
-
167
-
168
-
169
-
170
-
171
-
172
-
173
-
174
-
175
-
176
-
177
-
178
-
179
-
180
-
181
-
182
-
183
-
184
-
185
-
186
-
187
-
188
-
189
-
190
-
191
-
192
-
193
-
194
-
195
-
196
-
197
-
198
-
199
-
200
-
201
-
202
-
203
-
204
-
205
-
206
-
207
-
208
-
209
-
210
-
211
-
212
-
213
-
214
-
215
-
216
-
 217
217 -
 218
218 -
 219
219 -
 220
220 -
 221
221 -
 222
222 -
 223
223 -
 224
224 -
 225
225 -
 226
226 -
 227
227 -
 228
228 -
 229
229 -
 230
230 -
 231
231 -
 232
232 -
 233
233 -
 234
234 -
 235
235 -
 236
236 -
 237
237 -
238
-
239
-
240
 |
 |

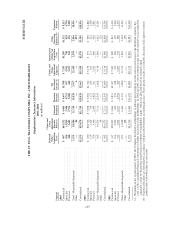
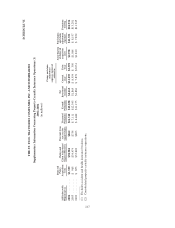
SCHEDULE III
THE ST. PAUL TRAVELERS COMPANIES, INC. AND SUBSIDIARIES
Supplementary Insurance Information
2002-2004
(in millions)
Segment
Deferred
Policy
Acquisition
Costs
Claims and
Claim
Adjustment
Expense
Reserves
Unearned
Premiums
Premium
Revenue
Net
Investment
Income (a)
Claims and
Claim
Adjustment
Expenses
Amortization
of Deferred
Acquisition
Costs
Other
Operating
Expenses (b)
Premiums
Written
2004
Commercial ............................... $ 607 $41,552 $ 4,606 $ 8,667 $1,708 $ 7,243 $1,289 $1,532 $ 8,213
Specialty ................................. 504 13,829 3,948 4,791 507 4,941 748 828 4,794
Personal .................................. 448 3,603 2,756 5,580 442 3,255 941 536 5,929
Total—Reportable Segments ................. 1,559 58,984 11,310 19,038 2,657 15,439 2,978 2,896 18,936
Other .................................... — 86 — — 6 — — 493 —
Consolidated .............................. $1,559 $59,070 $11,310 $19,038 $2,663 $15,439 $2,978 $3,389 $18,936
2003
Commercial ............................... $ 470 $28,746 $ 3,958 $ 6,552 $1,324 $ 5,170 $ 971 $ 990 $ 6,862
Specialty ................................. 119 2,428 714 1,171 183 613 213 222 1,258
Personal .................................. 376 3,300 2,439 4,822 361 3,335 800 420 5,081
Total—Reportable Segments ................. 965 34,474 7,111 12,545 1,868 9,118 1,984 1,632 13,201
Other .................................... — 99 — — 1 — — 176 —
Consolidated .............................. $ 965 $34,573 $ 7,111 $12,545 $1,869 $ 9,118 $1,984 $1,808 $13,201
2002
Commercial ............................... $ 437 $28,092 $ 3,664 $ 5,831 $1,307 $ 7,400 $ 889 $ 835 $ 6,330
Specialty ................................. 104 2,502 629 970 188 532 184 199 1,040
Personal .................................. 332 3,034 2,167 4,354 385 3,207 737 388 4,575
Total—Reportable Segments ................. 873 33,628 6,460 11,155 1,880 11,139 1,810 1,422 11,945
Other .................................... — 108 — — 1 — — 159 —
Consolidated .............................. $ 873 $33,736 $ 6,460 $11,155 $1,881 $11,139 $1,810 $1,581 $11,945
(a) Beginning in the second quarter of 2004, the Company developed a methodology to allocate net investment income and invested assets to the identified segments. See
note 1 to the consolidated financial statements for further discussion of this methodology. In 2002 and 2003, net investment income for each segment was accounted for
separately, except for the portion earned on the investment of shareholders’ equity, which was allocated based on assigned capital.
(b) Expense allocations are determined in accordance with prescribed statutory accounting practices. These practices make a reasonable allocation of all expenses to those
product lines with which they are associated.
215