Travelers 2004 Annual Report Download - page 69
Download and view the complete annual report
Please find page 69 of the 2004 Travelers annual report below. You can navigate through the pages in the report by either clicking on the pages listed below, or by using the keyword search tool below to find specific information within the annual report.-
 1
1 -
2
-
3
-
4
-
5
-
6
-
7
-
8
-
9
-
10
-
11
-
12
-
13
-
14
-
15
-
16
-
17
-
18
-
19
-
20
-
21
-
22
-
23
-
24
-
25
-
26
-
27
-
28
-
29
-
30
-
31
-
32
-
33
-
34
-
35
-
36
-
37
-
38
-
39
-
40
-
41
-
42
-
43
-
44
-
45
-
46
-
47
-
48
-
49
-
50
-
51
-
52
-
53
-
54
-
55
-
56
-
57
-
58
-
 59
59 -
 60
60 -
 61
61 -
 62
62 -
 63
63 -
 64
64 -
 65
65 -
 66
66 -
 67
67 -
 68
68 -
 69
69 -
 70
70 -
 71
71 -
 72
72 -
 73
73 -
 74
74 -
 75
75 -
 76
76 -
 77
77 -
 78
78 -
 79
79 -
80
-
81
-
82
-
83
-
84
-
85
-
86
-
87
-
88
-
89
-
90
-
91
-
92
-
93
-
94
-
95
-
96
-
97
-
98
-
99
-
100
-
101
-
102
-
103
-
104
-
105
-
106
-
107
-
108
-
109
-
110
-
111
-
112
-
113
-
114
-
115
-
116
-
117
-
118
-
119
-
120
-
121
-
122
-
123
-
124
-
125
-
126
-
127
-
128
-
129
-
130
-
131
-
132
-
133
-
134
-
135
-
136
-
137
-
138
-
139
-
140
-
141
-
142
-
143
-
144
-
145
-
146
-
147
-
148
-
149
-
150
-
151
-
152
-
153
-
154
-
155
-
156
-
157
-
158
-
159
-
160
-
161
-
162
-
163
-
164
-
165
-
166
-
167
-
168
-
169
-
170
-
171
-
172
-
173
-
174
-
175
-
176
-
177
-
178
-
179
-
180
-
181
-
182
-
183
-
184
-
185
-
186
-
187
-
188
-
189
-
190
-
191
-
192
-
193
-
194
-
195
-
196
-
197
-
198
-
199
-
200
-
201
-
202
-
203
-
204
-
205
-
206
-
207
-
208
-
209
-
210
-
211
-
212
-
213
-
214
-
215
-
216
-
217
-
218
-
219
-
220
-
221
-
222
-
223
-
224
-
225
-
226
-
227
-
228
-
229
-
230
-
231
-
232
-
233
-
234
-
235
-
236
-
237
-
238
-
239
-
240
 |
 |

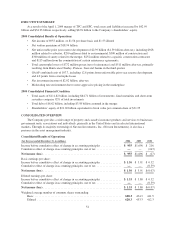
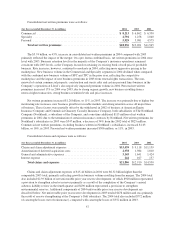
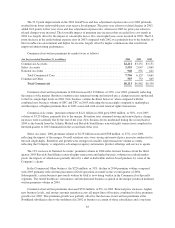
Consolidated net written premiums were as follows:
(for the year ended December 31, in millions) 2004 2003 2002
Commercial ....................................................... $ 8,213 $ 6,862 $ 6,330
Specialty .......................................................... 4,794 1,258 1,040
Personal .......................................................... 5,929 5,081 4,575
Total net written premiums ...................................... $18,936 $13,201 $11,945
The $5.74 billion, or 43%, increase in consolidated net written premiums in 2004 compared with 2003
primarily reflected the impact of the merger. On a pro forma combined basis, net written premiums in 2004 were
level with 2003. Business retention levels in the majority of the Company’s insurance operations remained
consistent with 2003 levels, as the Company focused on retaining its existing book of well priced, profitable
business. Rate increases, however, continued to moderate in 2004, reflecting more aggressive pricing in the
marketplace. New business volume in the Commercial and Specialty segments in 2004 declined when compared
with the combined new business volume of SPC and TPC in the prior year, reflecting the competitive
marketplace and the impact of new business premiums in 2003 from renewal rights transactions. The non-
renewal of certain commercial property, construction and surety risks and certain personal lines business in the
Company’s operations at Lloyd’s also negatively impacted premium volume in 2004. Personal net written
premiums increased 17% in 2004 over 2003, due to strong organic growth, new business resulting from a
renewal rights transaction, strong business retention levels and price increases.
Net written premiums increased $1.26 billion, or 11%, in 2003. The increase was primarily due to higher but
moderating rate increases, new business growth in favorable markets and strong retention across all major lines
of business. These factors were partially offset by the withdrawal in 2002 of business at American Equity
Insurance Company and Commercial Guaranty Casualty Insurance Company, both subsidiaries of The Northland
Company (Northland), a subsidiary of the Company, and a one-time additional $115 million of net written
premiums in 2002 due to the termination of certain reinsurance contracts by Northland. Net written premiums for
Northland’s subsidiaries in 2003 were $547 million, a decrease of 34% from the 2002 total of $825 million.
Commercial net written premiums, excluding business written in Northland’s subsidiaries, increased $1.03
billion, or 16%, in 2003. Personal net written premiums increased $506 million, or 11%, in 2003.
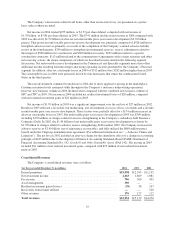
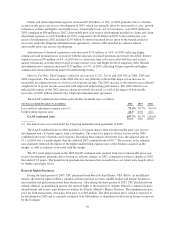
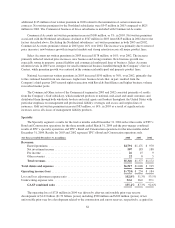
Consolidated claims and expenses were as follows:
(for the year ended December 31, in millions) 2004 2003 2002
Claims and claim adjustment expenses .................................. $15,439 $ 9,118 $11,139
Amortization of deferred acquisition costs ............................... 2,978 1,984 1,810
General and administrative expenses .................................... 3,145 1,641 1,424
Interest expense .................................................... 244 167 157
Total claims and expenses ....................................... $21,806 $12,910 $14,530
Claims and claim adjustment expenses of $15.44 billion in 2004 were $6.32 billion higher than the
comparable 2003 total, primarily reflecting growth in business volume resulting from the merger. The 2004 total
also included $2.39 billion of net unfavorable prior year reserve development, of which $928 million represented
a provision to strengthen asbestos reserves primarily as a result of the completion of the Company’s annual
asbestos liability review in the fourth quarter and $290 million represented a provision to strengthen
environmental reserves. Additional components of 2004 unfavorable prior year reserve development are
described below. Net unfavorable prior year reserve development in 2003 totaled $476 million and was primarily
the result of reserve strengthening at the Company’s Gulf subsidiary. The 2004 total also included $772 million
of catastrophe losses (net of reinsurance), compared with catastrophe losses of $352 million in 2003.
57