Travelers 2004 Annual Report Download - page 90
Download and view the complete annual report
Please find page 90 of the 2004 Travelers annual report below. You can navigate through the pages in the report by either clicking on the pages listed below, or by using the keyword search tool below to find specific information within the annual report.-
 1
1 -
2
-
3
-
4
-
5
-
6
-
7
-
8
-
9
-
10
-
11
-
12
-
13
-
14
-
15
-
16
-
17
-
18
-
19
-
20
-
21
-
22
-
23
-
24
-
25
-
26
-
27
-
28
-
29
-
30
-
31
-
32
-
33
-
34
-
35
-
36
-
37
-
38
-
39
-
40
-
41
-
42
-
43
-
44
-
45
-
46
-
47
-
48
-
49
-
50
-
51
-
52
-
53
-
54
-
55
-
56
-
57
-
58
-
59
-
60
-
61
-
62
-
63
-
64
-
65
-
66
-
67
-
68
-
69
-
70
-
71
-
72
-
73
-
74
-
75
-
76
-
77
-
78
-
79
-
 80
80 -
 81
81 -
 82
82 -
 83
83 -
 84
84 -
 85
85 -
 86
86 -
 87
87 -
 88
88 -
 89
89 -
 90
90 -
 91
91 -
 92
92 -
 93
93 -
 94
94 -
 95
95 -
 96
96 -
 97
97 -
 98
98 -
 99
99 -
 100
100 -
101
-
102
-
103
-
104
-
105
-
106
-
107
-
108
-
109
-
110
-
111
-
112
-
113
-
114
-
115
-
116
-
117
-
118
-
119
-
120
-
121
-
122
-
123
-
124
-
125
-
126
-
127
-
128
-
129
-
130
-
131
-
132
-
133
-
134
-
135
-
136
-
137
-
138
-
139
-
140
-
141
-
142
-
143
-
144
-
145
-
146
-
147
-
148
-
149
-
150
-
151
-
152
-
153
-
154
-
155
-
156
-
157
-
158
-
159
-
160
-
161
-
162
-
163
-
164
-
165
-
166
-
167
-
168
-
169
-
170
-
171
-
172
-
173
-
174
-
175
-
176
-
177
-
178
-
179
-
180
-
181
-
182
-
183
-
184
-
185
-
186
-
187
-
188
-
189
-
190
-
191
-
192
-
193
-
194
-
195
-
196
-
197
-
198
-
199
-
200
-
201
-
202
-
203
-
204
-
205
-
206
-
207
-
208
-
209
-
210
-
211
-
212
-
213
-
214
-
215
-
216
-
217
-
218
-
219
-
220
-
221
-
222
-
223
-
224
-
225
-
226
-
227
-
228
-
229
-
230
-
231
-
232
-
233
-
234
-
235
-
236
-
237
-
238
-
239
-
240
 |
 |
the Company’s previous assessment of these claims, the number and outcome of direct actions against the
Company and future developments pertaining to the Company’s ability to recover reinsurance for asbestos and
environmental claims. In addition, the Company sees, as an emerging trend, an increase in the Company’s
asbestos-related loss and loss expense experience as a result of the exhaustion or unavailability due to insolvency
of other insurance potentially available to policyholders along with the insolvency or bankruptcy of other
defendants. It is also not possible to predict changes in the legal and legislative environment and their impact on
the future development of asbestos and environmental claims. This development will be affected by future court
decisions and interpretations, as well as changes in applicable legislation. It is also difficult to predict the
ultimate outcome of large coverage disputes until settlement negotiations near completion and significant legal
questions are resolved or, failing settlement, until the dispute is adjudicated. This is particularly the case with
policyholders in bankruptcy where negotiations often involve a large number of claimants and other parties and
require court approval to be effective. As part of its continuing analysis of asbestos reserves, which includes an
annual ground-up review of asbestos policyholders, the Company continues to study the implications of these
and other developments. The Company completed the annual ground-up review, which included the asbestos
liabilities acquired in the merger, during the fourth quarter of 2004. Also see “Item 3—Legal Proceedings.”
Because of the uncertainties set forth above, additional liabilities may arise for amounts in excess of the
current related reserves. In addition, the Company’s estimate of claims and claim adjustment expenses may
change. These additional liabilities or increases in estimates, or a range of either, cannot now be reasonably
estimated and could result in income statement charges that could be material to the Company’s operating results
and financial condition in future periods.
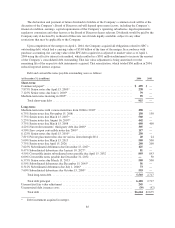
INVESTMENT PORTFOLIO
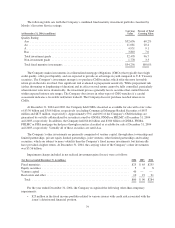
The Company’s invested assets at December 31, 2004 totaled $64.71 billion, including $477 million of
securities in process of settlement, of which 92% was invested in fixed maturity and short-term investments, 1%
in common stocks and other equity securities, 1% in mortgage loans and real estate and 6% in other investments.
Excluding the impact on invested assets of securities lending, unrealized investment gains and losses, receivables
for investment sales and payables on investment purchases, the pretax average yield was 4.8%, 5.3% and 6.0%
and the after tax average yield was 3.7%, 4.0% and 4.4% for the years ended December 31, 2004, 2003 and 2002,
respectively.
Because the primary purpose of the investment portfolio is to fund future claims payments, the Company
employs a conservative investment philosophy. The Company’s fixed maturity portfolio at December 31, 2004
totaled $54.26 billion, comprising $53.93 billion of publicly traded fixed maturities and $328 million of private
fixed maturities. The weighted average quality ratings of the Company’s publicly traded fixed maturity portfolio
and private fixed maturity portfolio at December 31, 2004 were AA2 and A3, respectively. Included in the fixed
maturity portfolio at that date was approximately $1.78 billion of below investment grade securities. During
2004, holdings of tax-exempt securities were increased to $26.58 billion to take advantage of their relatively high
credit quality and attractive after-tax yields. The average effective duration of the fixed maturity portfolio,
including short-term investments, was 4.1 years as of December 31, 2004 (4.4 years excluding short-term
investments), unchanged from December 31, 2003.
78