Travelers 2004 Annual Report Download - page 92
Download and view the complete annual report
Please find page 92 of the 2004 Travelers annual report below. You can navigate through the pages in the report by either clicking on the pages listed below, or by using the keyword search tool below to find specific information within the annual report.-
 1
1 -
2
-
3
-
4
-
5
-
6
-
7
-
8
-
9
-
10
-
11
-
12
-
13
-
14
-
15
-
16
-
17
-
18
-
19
-
20
-
21
-
22
-
23
-
24
-
25
-
26
-
27
-
28
-
29
-
30
-
31
-
32
-
33
-
34
-
35
-
36
-
37
-
38
-
39
-
40
-
41
-
42
-
43
-
44
-
45
-
46
-
47
-
48
-
49
-
50
-
51
-
52
-
53
-
54
-
55
-
56
-
57
-
58
-
59
-
60
-
61
-
62
-
63
-
64
-
65
-
66
-
67
-
68
-
69
-
70
-
71
-
72
-
73
-
74
-
75
-
76
-
77
-
78
-
79
-
80
-
81
-
 82
82 -
 83
83 -
 84
84 -
 85
85 -
 86
86 -
 87
87 -
 88
88 -
 89
89 -
 90
90 -
 91
91 -
 92
92 -
 93
93 -
 94
94 -
 95
95 -
 96
96 -
 97
97 -
 98
98 -
 99
99 -
 100
100 -
 101
101 -
 102
102 -
103
-
104
-
105
-
106
-
107
-
108
-
109
-
110
-
111
-
112
-
113
-
114
-
115
-
116
-
117
-
118
-
119
-
120
-
121
-
122
-
123
-
124
-
125
-
126
-
127
-
128
-
129
-
130
-
131
-
132
-
133
-
134
-
135
-
136
-
137
-
138
-
139
-
140
-
141
-
142
-
143
-
144
-
145
-
146
-
147
-
148
-
149
-
150
-
151
-
152
-
153
-
154
-
155
-
156
-
157
-
158
-
159
-
160
-
161
-
162
-
163
-
164
-
165
-
166
-
167
-
168
-
169
-
170
-
171
-
172
-
173
-
174
-
175
-
176
-
177
-
178
-
179
-
180
-
181
-
182
-
183
-
184
-
185
-
186
-
187
-
188
-
189
-
190
-
191
-
192
-
193
-
194
-
195
-
196
-
197
-
198
-
199
-
200
-
201
-
202
-
203
-
204
-
205
-
206
-
207
-
208
-
209
-
210
-
211
-
212
-
213
-
214
-
215
-
216
-
217
-
218
-
219
-
220
-
221
-
222
-
223
-
224
-
225
-
226
-
227
-
228
-
229
-
230
-
231
-
232
-
233
-
234
-
235
-
236
-
237
-
238
-
239
-
240
 |
 |

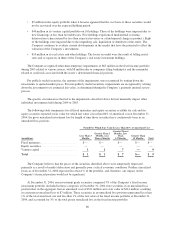
• $5 million in the equity portfolio when it became apparent that the cost basis of those securities would
not be recovered over the expected holding period.
• $40 million in its venture capital portfolio on 16 holdings. Three of the holdings were impaired due to
new financings at less than favorable rates. Five holdings experienced fundamental economic
deterioration (characterized by less than expected revenues or a fundamental change in product). Eight
of the holdings were impaired due to the impending sale, liquidation or shutdown of the entity. The
Company continues to evaluate current developments in the market that have the potential to affect the
valuation of the Company’s investments.
• $10 million in its real estate and other holdings. The losses recorded were the result of falling rental
rates and occupancies in three of the Company’s real estate investment holdings.
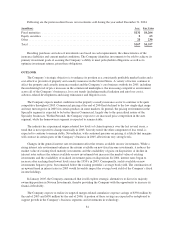
The Company recognized other-than-temporary impairments of $65 million in the fixed income portfolio
during 2003 related to various issuers, with $8 million due to companies filing bankruptcy and the remainder
related to credit risk associated with the issuer’s deteriorated financial position.
For publicly traded securities, the amounts of the impairments were recognized by writing down the
investments to quoted market prices. For non-publicly traded securities, impairments are recognized by writing
down the investment to its estimated fair value, as determined during the Company’s quarterly internal review
process.
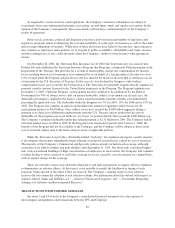
The specific circumstances that led to the impairments described above did not materially impact other
individual investments held during 2004 or 2003.
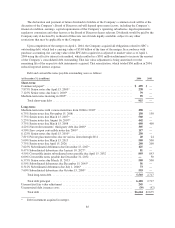
The following table summarizes for all fixed maturities and equity securities available for sale and for
equity securities reported at fair value for which fair value is less than 80% of amortized cost at December 31,
2004, the gross unrealized investment loss by length of time those securities have continuously been in an
unrealized loss position:
Period For Which Fair Value Is Less Than 80% of Amortized Cost
(in millions)
Less Than 3
Months
Greater Than 3
Months, Less
Than 6 Months
Greater Than 6
Months, Less
Than
12 Months
Greater Than
12 Months Total
Fixed maturities ......................... $— $— $— $— $—
Equity securities ........................ — — — — —
Venture capital ......................... 11 7—9
Total ................................. $1 $1 $7 $— $9
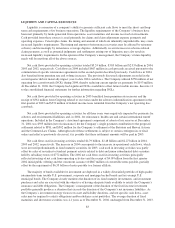
The Company believes that the prices of the securities identified above were temporarily depressed
primarily as a result of market dislocation and generally poor cyclical economic conditions. Further, unrealized
losses as of December 31, 2004 represent less than 1% of the portfolio, and, therefore, any impact on the
Company’s financial position would not be significant.
At December 31, 2004, non-investment grade securities comprised 3% of the Company’s fixed income
investment portfolio. Included in those categories at December 31, 2004 were securities in an unrealized loss
position that, in the aggregate, had an amortized cost of $321 million and a fair value of $314 million, resulting
in a net pretax unrealized loss of $7 million. These securities in an unrealized loss position represented less than
1% of the total amortized cost and less than 1% of the fair value of the fixed income portfolio at December 31,
2004, and accounted for 3% of the total pretax unrealized loss in the fixed income portfolio.
80