Travelers 2004 Annual Report Download - page 67
Download and view the complete annual report
Please find page 67 of the 2004 Travelers annual report below. You can navigate through the pages in the report by either clicking on the pages listed below, or by using the keyword search tool below to find specific information within the annual report.-
 1
1 -
2
-
3
-
4
-
5
-
6
-
7
-
8
-
9
-
10
-
11
-
12
-
13
-
14
-
15
-
16
-
17
-
18
-
19
-
20
-
21
-
22
-
23
-
24
-
25
-
26
-
27
-
28
-
29
-
30
-
31
-
32
-
33
-
34
-
35
-
36
-
37
-
38
-
39
-
40
-
41
-
42
-
43
-
44
-
45
-
46
-
47
-
48
-
49
-
50
-
51
-
52
-
53
-
54
-
55
-
56
-
 57
57 -
 58
58 -
 59
59 -
 60
60 -
 61
61 -
 62
62 -
 63
63 -
 64
64 -
 65
65 -
 66
66 -
 67
67 -
 68
68 -
 69
69 -
 70
70 -
 71
71 -
 72
72 -
 73
73 -
 74
74 -
 75
75 -
 76
76 -
 77
77 -
78
-
79
-
80
-
81
-
82
-
83
-
84
-
85
-
86
-
87
-
88
-
89
-
90
-
91
-
92
-
93
-
94
-
95
-
96
-
97
-
98
-
99
-
100
-
101
-
102
-
103
-
104
-
105
-
106
-
107
-
108
-
109
-
110
-
111
-
112
-
113
-
114
-
115
-
116
-
117
-
118
-
119
-
120
-
121
-
122
-
123
-
124
-
125
-
126
-
127
-
128
-
129
-
130
-
131
-
132
-
133
-
134
-
135
-
136
-
137
-
138
-
139
-
140
-
141
-
142
-
143
-
144
-
145
-
146
-
147
-
148
-
149
-
150
-
151
-
152
-
153
-
154
-
155
-
156
-
157
-
158
-
159
-
160
-
161
-
162
-
163
-
164
-
165
-
166
-
167
-
168
-
169
-
170
-
171
-
172
-
173
-
174
-
175
-
176
-
177
-
178
-
179
-
180
-
181
-
182
-
183
-
184
-
185
-
186
-
187
-
188
-
189
-
190
-
191
-
192
-
193
-
194
-
195
-
196
-
197
-
198
-
199
-
200
-
201
-
202
-
203
-
204
-
205
-
206
-
207
-
208
-
209
-
210
-
211
-
212
-
213
-
214
-
215
-
216
-
217
-
218
-
219
-
220
-
221
-
222
-
223
-
224
-
225
-
226
-
227
-
228
-
229
-
230
-
231
-
232
-
233
-
234
-
235
-
236
-
237
-
238
-
239
-
240
 |
 |

The Company’s discussions related to all items, other than net income (loss), are presented on a pretax
basis, unless otherwise noted.
Net income in 2004 totaled $955 million, or $1.53 per share diluted, compared with net income of
$1.70 billion, or $3.80 per share diluted, in 2003. The $741 million decline in net income in 2004 compared with
2003 was driven by $1.59 billion of after-tax net unfavorable prior-year reserve development ($2.39 billion
pretax). That pretax net unfavorable prior year reserve development was primarily comprised of $928 million to
strengthen asbestos reserves primarily as a result of the completion of the Company’s annual asbestos liability
review in the fourth quarter, $290 million to strengthen environmental reserves, reserve adjustments related to
the merger of $500 million for construction and $300 million for surety, $252 million related to a specific
construction contractor, $113 million related to the commutation of agreements with a major reinsurer and other
net reserving actions, the major components of which are described in more detail in the following segment
discussions. Net unfavorable reserve development in the Commercial and Specialty segments more than offset
additional income resulting from the merger and strong operating income generated by the Company’s Personal
segment. In addition, after-tax catastrophe losses in 2004 of $511 million were $282 million higher than in 2003.
The catastrophe losses in 2004 were primarily driven by four hurricanes that struck the southeastern United
States in the third quarter.
The rate environment continued to moderate in 2004 due to more aggressive pricing in the marketplace.
Customer retention levels remained stable throughout the Company’s insurance underwriting operations;
however, new business volume in 2004 declined when compared with the combined new business volume of
SPC and TPC in 2003. Net income in 2004 included net realized investment losses of $28 million, compared
with net realized investment gains of $21 million in 2003.
Net income of $1.70 billion in 2003 was a significant improvement over the net loss of $27 million in 2002.
Results in 2003 reflected a favorable, but moderating, rate environment in excess of loss cost trends and a decline
in unfavorable prior year reserve development. Those factors were partially offset by a $174 million increase in
after-tax catastrophe losses in 2003. Net unfavorable prior year reserve development in 2003 was $309 million,
including $339 million of charges related to reserve strengthening in the Company’s subsidiary Gulf Insurance
Company (Gulf). In 2002, the $1.49 billion of net unfavorable prior year reserve development was driven by
$1.39 billion of charges related to asbestos reserve strengthening. In December 2002, the Company increased its
asbestos reserves to $3.40 billion, net of reinsurance recoverables, and fully utilized the $800 million pretax
benefit under the Citigroup indemnification agreement. (For additional information see “—Asbestos Claims and
Litigation”). The net loss in 2002 included an after-tax charge for the cumulative effect of a change in accounting
principle of $243 million due to the adoption of Financial Accounting Standards Board (FASB) Statement of
Financial Accounting Standards No. 142, Goodwill and Other Intangible Assets (FAS 142). Net income in 2003
included $21 million of net realized investment gains, compared with $99 million of net realized investment
gains in 2002.
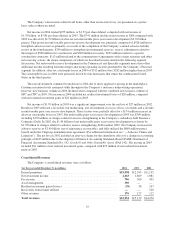
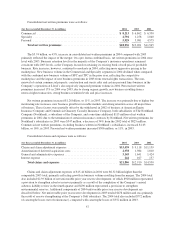
Consolidated Revenues
The Company’s consolidated revenues were as follows:
(for the year ended December 31, in millions) 2004 2003 2002
Earned premiums ................................................... $19,038 $12,545 $11,155
Net investment income ............................................... 2,663 1,869 1,881
Fee income ........................................................ 706 560 455
Asset management .................................................. 390 ——
Realized investment gains (losses) ...................................... (39) 38 147
Recoveries from former affiliate ....................................... —— 520
Other revenues ..................................................... 176 127 112
Total revenues ..................................................... $22,934 $15,139 $14,270
55