Travelers 2004 Annual Report Download - page 161
Download and view the complete annual report
Please find page 161 of the 2004 Travelers annual report below. You can navigate through the pages in the report by either clicking on the pages listed below, or by using the keyword search tool below to find specific information within the annual report.-
 1
1 -
2
-
3
-
4
-
5
-
6
-
7
-
8
-
9
-
10
-
11
-
12
-
13
-
14
-
15
-
16
-
17
-
18
-
19
-
20
-
21
-
22
-
23
-
24
-
25
-
26
-
27
-
28
-
29
-
30
-
31
-
32
-
33
-
34
-
35
-
36
-
37
-
38
-
39
-
40
-
41
-
42
-
43
-
44
-
45
-
46
-
47
-
48
-
49
-
50
-
51
-
52
-
53
-
54
-
55
-
56
-
57
-
58
-
59
-
60
-
61
-
62
-
63
-
64
-
65
-
66
-
67
-
68
-
69
-
70
-
71
-
72
-
73
-
74
-
75
-
76
-
77
-
78
-
79
-
80
-
81
-
82
-
83
-
84
-
85
-
86
-
87
-
88
-
89
-
90
-
91
-
92
-
93
-
94
-
95
-
96
-
97
-
98
-
99
-
100
-
101
-
102
-
103
-
104
-
105
-
106
-
107
-
108
-
109
-
110
-
111
-
112
-
113
-
114
-
115
-
116
-
117
-
118
-
119
-
120
-
121
-
122
-
123
-
124
-
125
-
126
-
127
-
128
-
129
-
130
-
131
-
132
-
133
-
134
-
135
-
136
-
137
-
138
-
139
-
140
-
141
-
142
-
143
-
144
-
145
-
146
-
147
-
148
-
149
-
150
-
 151
151 -
 152
152 -
 153
153 -
 154
154 -
 155
155 -
 156
156 -
 157
157 -
 158
158 -
 159
159 -
 160
160 -
 161
161 -
 162
162 -
 163
163 -
 164
164 -
 165
165 -
 166
166 -
 167
167 -
 168
168 -
 169
169 -
 170
170 -
 171
171 -
172
-
173
-
174
-
175
-
176
-
177
-
178
-
179
-
180
-
181
-
182
-
183
-
184
-
185
-
186
-
187
-
188
-
189
-
190
-
191
-
192
-
193
-
194
-
195
-
196
-
197
-
198
-
199
-
200
-
201
-
202
-
203
-
204
-
205
-
206
-
207
-
208
-
209
-
210
-
211
-
212
-
213
-
214
-
215
-
216
-
217
-
218
-
219
-
220
-
221
-
222
-
223
-
224
-
225
-
226
-
227
-
228
-
229
-
230
-
231
-
232
-
233
-
234
-
235
-
236
-
237
-
238
-
239
-
240
 |
 |

THE ST. PAUL TRAVELERS COMPANIES, INC. AND SUBSIDIARIES
NOTES TO CONSOLIDATED FINANCIAL STATEMENTS—(Continued)
6. INVESTMENTS, Continued
Underperforming mortgage loans, which include delinquent loans, loans in the process of foreclosure and
loans modified at interest rates below market, were $4 million and $31 million at December 31, 2004 and 2003,
respectively.
Concentrations and Credit Quality
At December 31, 2004 and 2003, the Company had concentrations of credit risk in tax-exempt investments
of the state of Texas of $2.30 billion and $1.54 billion, respectively, of the state of Illinois of $1.50 billion and
$872 million, respectively, and of the state of New York of $1.44 billion and $1.35 billion, respectively.
Included in fixed maturities are below investment grade assets totaling $1.78 billion and $2.06 billion at
December 31, 2004 and 2003, respectively. The Company defines its below investment grade assets as those
securities rated below investment grade by external rating agencies, or the equivalent by the Company’s
investment advisors when a public rating does not exist. Such assets include publicly traded below investment
grade bonds and certain other privately issued bonds that are classified as below investment grade loans.
The Company monitors creditworthiness of counterparties to financial instruments by using controls that
include credit approvals, limits and other monitoring procedures.
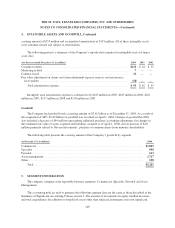
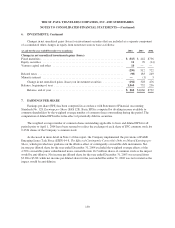
Net Investment Income
(for the year ended December 31, in millions) 2004 2003 2002
Gross investment income
Fixed maturities ....................................................... $2,128 $1,527 $1,630
Equity securities ....................................................... 47 143 98
Short-term securities ................................................... 70 107 57
Mortgage loans and real estate ............................................ 67 28 35
Other investments ...................................................... 456 119 117
Gross investment income ............................................ 2,768 1,924 1,937
Investment expenses .................................................... 105 55 56
Net investment income .............................................. $2,663 $1,869 $1,881
Net Realized and Unrealized Investment Gains (Losses)
Net realized investment gains (losses) for the periods were as follows:
(for the year ended December 31, in millions) 2004 2003 2002
Net realized investment gains (losses)
Fixed maturities ........................................................... $51 $ 69 $168
Equity securities ........................................................... 23 7 (4)
Venture capital and other .................................................... (113) (38) (17)
Net realized investment gains (losses) ...................................... $ (39) $ 38 $147
149