Travelers 2004 Annual Report Download - page 124
Download and view the complete annual report
Please find page 124 of the 2004 Travelers annual report below. You can navigate through the pages in the report by either clicking on the pages listed below, or by using the keyword search tool below to find specific information within the annual report.-
 1
1 -
2
-
3
-
4
-
5
-
6
-
7
-
8
-
9
-
10
-
11
-
12
-
13
-
14
-
15
-
16
-
17
-
18
-
19
-
20
-
21
-
22
-
23
-
24
-
25
-
26
-
27
-
28
-
29
-
30
-
31
-
32
-
33
-
34
-
35
-
36
-
37
-
38
-
39
-
40
-
41
-
42
-
43
-
44
-
45
-
46
-
47
-
48
-
49
-
50
-
51
-
52
-
53
-
54
-
55
-
56
-
57
-
58
-
59
-
60
-
61
-
62
-
63
-
64
-
65
-
66
-
67
-
68
-
69
-
70
-
71
-
72
-
73
-
74
-
75
-
76
-
77
-
78
-
79
-
80
-
81
-
82
-
83
-
84
-
85
-
86
-
87
-
88
-
89
-
90
-
91
-
92
-
93
-
94
-
95
-
96
-
97
-
98
-
99
-
100
-
101
-
102
-
103
-
104
-
105
-
106
-
107
-
108
-
109
-
110
-
111
-
112
-
113
-
 114
114 -
 115
115 -
 116
116 -
 117
117 -
 118
118 -
 119
119 -
 120
120 -
 121
121 -
 122
122 -
 123
123 -
 124
124 -
 125
125 -
 126
126 -
 127
127 -
 128
128 -
 129
129 -
 130
130 -
 131
131 -
 132
132 -
 133
133 -
 134
134 -
135
-
136
-
137
-
138
-
139
-
140
-
141
-
142
-
143
-
144
-
145
-
146
-
147
-
148
-
149
-
150
-
151
-
152
-
153
-
154
-
155
-
156
-
157
-
158
-
159
-
160
-
161
-
162
-
163
-
164
-
165
-
166
-
167
-
168
-
169
-
170
-
171
-
172
-
173
-
174
-
175
-
176
-
177
-
178
-
179
-
180
-
181
-
182
-
183
-
184
-
185
-
186
-
187
-
188
-
189
-
190
-
191
-
192
-
193
-
194
-
195
-
196
-
197
-
198
-
199
-
200
-
201
-
202
-
203
-
204
-
205
-
206
-
207
-
208
-
209
-
210
-
211
-
212
-
213
-
214
-
215
-
216
-
217
-
218
-
219
-
220
-
221
-
222
-
223
-
224
-
225
-
226
-
227
-
228
-
229
-
230
-
231
-
232
-
233
-
234
-
235
-
236
-
237
-
238
-
239
-
240
 |
 |

For invested assets with primary exposure to interest rate risk, estimates of portfolio duration and convexity
are used to model the loss of fair value that would be expected to result from a parallel increase in interest rates.
Durations on invested assets are adjusted for call, put and interest rate reset features. Durations on tax-exempt
securities are adjusted for the fact that the yields on such securities do not normally move in lockstep with
changes in the U.S. Treasury curve. Fixed maturity portfolio durations are calculated on a market value weighted
basis, including accrued interest, using holdings as of December 31, 2004 and 2003.
For debt, the change in fair value is determined by calculating hypothetical December 31, 2004 and 2003
ending prices based on yields adjusted to reflect a 100 basis point change, comparing such hypothetical ending
prices to actual ending prices, and multiplying the difference by the par or securities outstanding.
The sensitivity analysis model used by the Company produces a loss in fair value of market sensitive
instruments of approximately $2.1 billion and $1.2 billion based on a 100 basis point increase in interest rates as
of December 31, 2004 and 2003, respectively.
The loss estimates do not take into account the impact of possible interventions that the Company might
reasonably undertake in order to mitigate or avoid losses that would result from emerging interest rate trends. In
addition, the loss value only reflects the impact of an interest rate increase on the fair value of the Company’s
financial instruments. As a result, the loss value excludes a significant portion of the Company’s consolidated
balance sheet, which if included in the sensitivity analysis model, would mitigate the impact of the loss in fair
value associated with a 100 basis point increase in interest rates.
Foreign Currency Exchange Rate Risk
The Company uses fair values of investment securities to measure its potential loss from foreign
denominated investments. A hypothetical 10% reduction in value of foreign denominated investments is used to
estimate the impact on the market value of the foreign denominated holdings. The potential loss is reduced by
foreign currency forward transactions that are used to hedge a portion of the Company’s exposure to foreign
currencies. The Company’s analysis indicates that a hypothetical 10% reduction in the value of foreign
denominated investments would be expected to produce a loss in fair value of approximately $438 million at
December 31, 2004. The Company’s exposure to foreign exchange risk was not significant at December 31,
2003.
ITEM 8. FINANCIAL STATEMENTS AND SUPPLEMENTARY DATA
INDEX TO CONSOLIDATED FINANCIAL STATEMENTS
Page
Report of Independent Registered Public Accounting Firm ...................................... 113
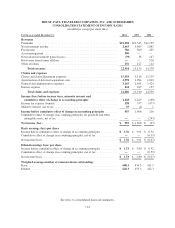
Consolidated Statement of Income (Loss) for the years ended December 31, 2004, 2003 and 2002 ....... 114
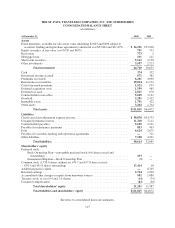
Consolidated Balance Sheet at December 31, 2004 and 2003 ..................................... 115
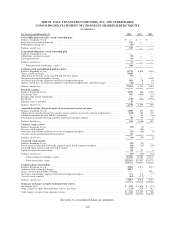
Consolidated Statement of Changes in Shareholders’ Equity for the years ended December 31, 2004, 2003
and 2002 ............................................................................ 116
Consolidated Statement of Cash Flows for the years ended December 31, 2004, 2003 and 2002 ......... 117
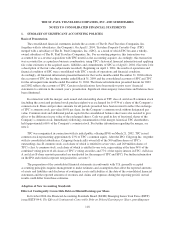
Notes to Consolidated Financial Statements .................................................. 118
112