Travelers 2004 Annual Report Download - page 162
Download and view the complete annual report
Please find page 162 of the 2004 Travelers annual report below. You can navigate through the pages in the report by either clicking on the pages listed below, or by using the keyword search tool below to find specific information within the annual report.-
 1
1 -
2
-
3
-
4
-
5
-
6
-
7
-
8
-
9
-
10
-
11
-
12
-
13
-
14
-
15
-
16
-
17
-
18
-
19
-
20
-
21
-
22
-
23
-
24
-
25
-
26
-
27
-
28
-
29
-
30
-
31
-
32
-
33
-
34
-
35
-
36
-
37
-
38
-
39
-
40
-
41
-
42
-
43
-
44
-
45
-
46
-
47
-
48
-
49
-
50
-
51
-
52
-
53
-
54
-
55
-
56
-
57
-
58
-
59
-
60
-
61
-
62
-
63
-
64
-
65
-
66
-
67
-
68
-
69
-
70
-
71
-
72
-
73
-
74
-
75
-
76
-
77
-
78
-
79
-
80
-
81
-
82
-
83
-
84
-
85
-
86
-
87
-
88
-
89
-
90
-
91
-
92
-
93
-
94
-
95
-
96
-
97
-
98
-
99
-
100
-
101
-
102
-
103
-
104
-
105
-
106
-
107
-
108
-
109
-
110
-
111
-
112
-
113
-
114
-
115
-
116
-
117
-
118
-
119
-
120
-
121
-
122
-
123
-
124
-
125
-
126
-
127
-
128
-
129
-
130
-
131
-
132
-
133
-
134
-
135
-
136
-
137
-
138
-
139
-
140
-
141
-
142
-
143
-
144
-
145
-
146
-
147
-
148
-
149
-
150
-
151
-
 152
152 -
 153
153 -
 154
154 -
 155
155 -
 156
156 -
 157
157 -
 158
158 -
 159
159 -
 160
160 -
 161
161 -
 162
162 -
 163
163 -
 164
164 -
 165
165 -
 166
166 -
 167
167 -
 168
168 -
 169
169 -
 170
170 -
 171
171 -
 172
172 -
173
-
174
-
175
-
176
-
177
-
178
-
179
-
180
-
181
-
182
-
183
-
184
-
185
-
186
-
187
-
188
-
189
-
190
-
191
-
192
-
193
-
194
-
195
-
196
-
197
-
198
-
199
-
200
-
201
-
202
-
203
-
204
-
205
-
206
-
207
-
208
-
209
-
210
-
211
-
212
-
213
-
214
-
215
-
216
-
217
-
218
-
219
-
220
-
221
-
222
-
223
-
224
-
225
-
226
-
227
-
228
-
229
-
230
-
231
-
232
-
233
-
234
-
235
-
236
-
237
-
238
-
239
-
240
 |
 |

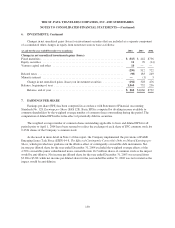
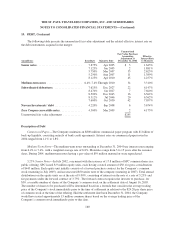
THE ST. PAUL TRAVELERS COMPANIES, INC. AND SUBSIDIARIES
NOTES TO CONSOLIDATED FINANCIAL STATEMENTS—(Continued)
6. INVESTMENTS, Continued
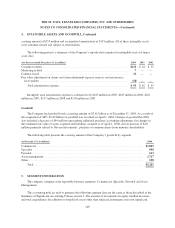
Changes in net unrealized gains (losses) on investment securities that are included as a separate component
of accumulated other changes in equity from nonowner sources were as follows:
(at and for the year ended December 31, in millions) 2004 2003 2002
Change in net unrealized investments gains (losses)
Fixed maturities ......................................................... $ (315) $ 442 $736
Equity securities ........................................................ 11 70 (14)
Venture capital and other ................................................. 14 ——
(290) 512 722
Related taxes ........................................................... (98) 183 249
Minority interest ........................................................ —(1) 3
Change in net unrealized gains (losses) on investment securities .............. (192) 328 476
Balance, beginning of year ................................................ 1,060 732 256
Balance, end of year ................................................. $ 868 $1,060 $732
7. EARNINGS PER SHARE
Earnings per share (EPS) has been computed in accordance with Statement of Financial Accounting
Standards No. 128, Earnings per Share (FAS 128). Basic EPS is computed by dividing income available to
common shareholders by the weighted average number of common shares outstanding during the period. The
computation of diluted EPS reflects the effect of potentially dilutive securities.
The weighted average number of common shares outstanding applicable to basic and diluted EPS for all
periods prior to April 1, 2004 have been restated to reflect the exchange of each share of TPC common stock for
0.4334 shares of the Company’s common stock.
As discussed in more detail in Note 1 of this report, the Company implemented the provisions of FASB
Emerging Issues Task Force (EITF) 04-8, The Effect of Contingently Convertible Debt on Diluted Earnings per
Share, which provided new guidance on the dilutive effect of contingently convertible debt instruments. Net
income per diluted share for the year ended December 31, 2004 excluded the weighted average effects of the
4.50% convertible junior subordinated notes convertible into 16.7 million shares of common stock as the impact
would be anti-dilutive. Net income per diluted share for the year ended December 31, 2003 was restated from
$3.88 to $3.80, while net income per diluted share for the year ended December 31, 2002 was not restated as the
impact would be anti-dilutive.
150