Travelers 2004 Annual Report Download - page 95
Download and view the complete annual report
Please find page 95 of the 2004 Travelers annual report below. You can navigate through the pages in the report by either clicking on the pages listed below, or by using the keyword search tool below to find specific information within the annual report.-
 1
1 -
2
-
3
-
4
-
5
-
6
-
7
-
8
-
9
-
10
-
11
-
12
-
13
-
14
-
15
-
16
-
17
-
18
-
19
-
20
-
21
-
22
-
23
-
24
-
25
-
26
-
27
-
28
-
29
-
30
-
31
-
32
-
33
-
34
-
35
-
36
-
37
-
38
-
39
-
40
-
41
-
42
-
43
-
44
-
45
-
46
-
47
-
48
-
49
-
50
-
51
-
52
-
53
-
54
-
55
-
56
-
57
-
58
-
59
-
60
-
61
-
62
-
63
-
64
-
65
-
66
-
67
-
68
-
69
-
70
-
71
-
72
-
73
-
74
-
75
-
76
-
77
-
78
-
79
-
80
-
81
-
82
-
83
-
84
-
 85
85 -
 86
86 -
 87
87 -
 88
88 -
 89
89 -
 90
90 -
 91
91 -
 92
92 -
 93
93 -
 94
94 -
 95
95 -
 96
96 -
 97
97 -
 98
98 -
 99
99 -
 100
100 -
 101
101 -
 102
102 -
 103
103 -
 104
104 -
 105
105 -
106
-
107
-
108
-
109
-
110
-
111
-
112
-
113
-
114
-
115
-
116
-
117
-
118
-
119
-
120
-
121
-
122
-
123
-
124
-
125
-
126
-
127
-
128
-
129
-
130
-
131
-
132
-
133
-
134
-
135
-
136
-
137
-
138
-
139
-
140
-
141
-
142
-
143
-
144
-
145
-
146
-
147
-
148
-
149
-
150
-
151
-
152
-
153
-
154
-
155
-
156
-
157
-
158
-
159
-
160
-
161
-
162
-
163
-
164
-
165
-
166
-
167
-
168
-
169
-
170
-
171
-
172
-
173
-
174
-
175
-
176
-
177
-
178
-
179
-
180
-
181
-
182
-
183
-
184
-
185
-
186
-
187
-
188
-
189
-
190
-
191
-
192
-
193
-
194
-
195
-
196
-
197
-
198
-
199
-
200
-
201
-
202
-
203
-
204
-
205
-
206
-
207
-
208
-
209
-
210
-
211
-
212
-
213
-
214
-
215
-
216
-
217
-
218
-
219
-
220
-
221
-
222
-
223
-
224
-
225
-
226
-
227
-
228
-
229
-
230
-
231
-
232
-
233
-
234
-
235
-
236
-
237
-
238
-
239
-
240
 |
 |
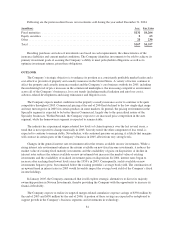
LIQUIDITY AND CAPITAL RESOURCES
Liquidity is a measure of a company’s ability to generate sufficient cash flows to meet the short- and long-
term cash requirements of its business operations. The liquidity requirements of the Company’s business have
been met primarily by funds generated from operations, asset maturities and income received on investments.
Cash provided from these sources is used primarily for claims and claim adjustment expense payments and
operating expenses. Catastrophe claims, the timing and amount of which are inherently unpredictable, may create
increased liquidity requirements. The timing and amount of reinsurance recoveries may be affected by reinsurer
solvency and increasingly by reinsurance coverage disputes. Additionally, recent increases in asbestos-related
claim payments, as well as potential judgments and settlements arising out of litigation, may also result in
increased liquidity requirements. In the opinion of the Company’s management, the Company’s future liquidity
needs will be met from all of the above sources.
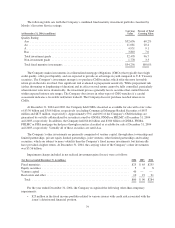
Net cash flows provided by operating activities totaled $5.24 billion, $3.83 billion and $2.93 billion in 2004,
2003 and 2002, respectively. Cash flows in 2004 included $867 million in cash proceeds received pursuant to the
commutation of specific reinsurance agreements in the second quarter described previously. Cash flows in 2004
also benefited from premium rate and volume increases. The previously discussed adjustments recorded in the
second quarter did not materially impact year-to-date 2004 cash flows. The Company utilized $550 million of net
operating loss carryforwards (NOL) during 2004, thereby reducing current regular tax payments by $193 million.
At December 31, 2004, the Company had significant NOLs available to offset future taxable income. See note 11
to the consolidated financial statements for further information regarding NOLs.
Net cash flows provided by operating activities in 2003 benefited from premium rate increases and the
receipt of $361 million from Citigroup related to recoveries under the asbestos indemnification agreement in the
first quarter of 2003 and $531 million of federal income taxes refunded from the Company’s net operating loss
carryback.
Net cash flows provided by operating activities for all three years were negatively impacted by payments for
asbestos and environmental liabilities and, in 2004, for reinsurance, health care and certain international runoff
operations. Included in the Company’s structured agreement component of asbestos loss reserves at December
31, 2004 was $395 million (net of reinsurance) for the Company’s single payment contribution to the proposed
settlement related to PPG, and $502 million for the Company’s settlement of the Statutory and Hawaii Actions
and the Common Law Claims. Although each of these settlements is subject to certain contingencies or final
orders and relief as previously discussed, it is possible that these settlement amounts will be paid in 2005.
Net cash flows used in investing activities totaled $4.79 billion, $2.48 billion and $2.27 billion in 2004,
2003 and 2002, respectively. The increase in 2004 corresponds to the increase in operational cash flows, which
were invested predominantly in fixed maturity securities. In 2003, cash used in investing activities was partly
offset by sales of securities to fund net payment activity related to debt and junior subordinated debt securities
held by subsidiary trusts of $772 million. The 2002 net cash flows used in investing activities principally
reflected investing of net cash from operating activities and the receipt of $4.09 billion from the first quarter
2002 initial public offering and the concurrent issuance of $867 million of convertible notes payable, partially
offset by the repayment of $6.35 billion of notes payable to a former affiliate.
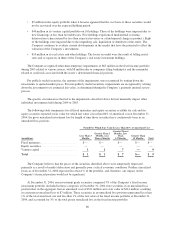
The majority of funds available for investment are deployed in a widely diversified portfolio of high quality
intermediate-term taxable U.S. government, corporate and mortgage backed bonds and tax-exempt U.S.
municipal bonds. The Company closely monitors the duration of its fixed maturity investments, and investment
purchases and sales are executed with the objective of having adequate funds available to satisfy the Company’s
insurance and debt obligations. The Company’s management of the duration of the fixed income investment
portfolio generally produces a duration that exceeds the duration of the Company’s net insurance liabilities. As
the Company’s investment strategy focuses on asset and liability durations, and not specific cash flows, asset
sales may be required to satisfy obligations and/or rebalance asset portfolios. The average duration of fixed
maturities and short-term securities was 4.1 years as of December 31, 2004, unchanged from December 31, 2003.
83