Travelers 2004 Annual Report Download - page 185
Download and view the complete annual report
Please find page 185 of the 2004 Travelers annual report below. You can navigate through the pages in the report by either clicking on the pages listed below, or by using the keyword search tool below to find specific information within the annual report.-
 1
1 -
2
-
3
-
4
-
5
-
6
-
7
-
8
-
9
-
10
-
11
-
12
-
13
-
14
-
15
-
16
-
17
-
18
-
19
-
20
-
21
-
22
-
23
-
24
-
25
-
26
-
27
-
28
-
29
-
30
-
31
-
32
-
33
-
34
-
35
-
36
-
37
-
38
-
39
-
40
-
41
-
42
-
43
-
44
-
45
-
46
-
47
-
48
-
49
-
50
-
51
-
52
-
53
-
54
-
55
-
56
-
57
-
58
-
59
-
60
-
61
-
62
-
63
-
64
-
65
-
66
-
67
-
68
-
69
-
70
-
71
-
72
-
73
-
74
-
75
-
76
-
77
-
78
-
79
-
80
-
81
-
82
-
83
-
84
-
85
-
86
-
87
-
88
-
89
-
90
-
91
-
92
-
93
-
94
-
95
-
96
-
97
-
98
-
99
-
100
-
101
-
102
-
103
-
104
-
105
-
106
-
107
-
108
-
109
-
110
-
111
-
112
-
113
-
114
-
115
-
116
-
117
-
118
-
119
-
120
-
121
-
122
-
123
-
124
-
125
-
126
-
127
-
128
-
129
-
130
-
131
-
132
-
133
-
134
-
135
-
136
-
137
-
138
-
139
-
140
-
141
-
142
-
143
-
144
-
145
-
146
-
147
-
148
-
149
-
150
-
151
-
152
-
153
-
154
-
155
-
156
-
157
-
158
-
159
-
160
-
161
-
162
-
163
-
164
-
165
-
166
-
167
-
168
-
169
-
170
-
171
-
172
-
173
-
174
-
 175
175 -
 176
176 -
 177
177 -
 178
178 -
 179
179 -
 180
180 -
 181
181 -
 182
182 -
 183
183 -
 184
184 -
 185
185 -
 186
186 -
 187
187 -
 188
188 -
 189
189 -
 190
190 -
 191
191 -
 192
192 -
 193
193 -
 194
194 -
 195
195 -
196
-
197
-
198
-
199
-
200
-
201
-
202
-
203
-
204
-
205
-
206
-
207
-
208
-
209
-
210
-
211
-
212
-
213
-
214
-
215
-
216
-
217
-
218
-
219
-
220
-
221
-
222
-
223
-
224
-
225
-
226
-
227
-
228
-
229
-
230
-
231
-
232
-
233
-
234
-
235
-
236
-
237
-
238
-
239
-
240
 |
 |

THE ST. PAUL TRAVELERS COMPANIES, INC. AND SUBSIDIARIES
NOTES TO CONSOLIDATED FINANCIAL STATEMENTS—(Continued)
13. INCENTIVE PLANS, Continued
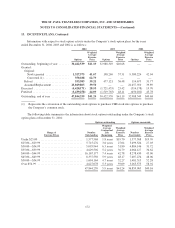
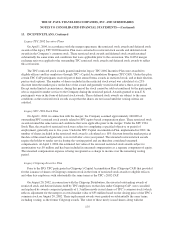
All original and reload stock options granted under the Company’s stock option programs had an exercise
price equal to the market value of the Company’s common stock on the date of grant. The stock option awards of
SPC assumed in the merger on April 1, 2004, the awards of CIRI converted on August 4, 2004, and the
replacement awards granted on August 20, 2002 retained the intrinsic value of the awards immediately prior to
being assumed, converted or replaced and therefore the exercise price either exceeded the market value or was
less than the market value on those respective dates. The following table presents the weighted average exercise
price and weighted average grant date fair value information with respect to these grants:
Options
Weighted
Average
Exercise
Price
Weighted
Average
Grant
Date Fair
Value
2004
Original awards
Exercise price equal to market at grant ............................ 1,881,158 $40.97 $ 9.27
Exercise price exceeds market at grant ............................ 350,188 $62.79 $ 6.42
Assumed awards
Exercise price exceeds market at grant ............................ 13,287,228 $45.13 $ 7.58
Exercise price less than market at grant ........................... 9,762,575 $31.88 $12.40
Total granted 2004 ....................................... 25,281,149 $39.95 $ 9.55
2003
Original awards
Exercise price equal to market at grant ............................ 675,390 $36.73 $ 2.86
2002
Original awards
Exercise price equal to market at grant ............................ 9,494,899 $41.90 $13.47
Replacement awards
Exercise price exceeds market at grant ............................ 12,006,955 $54.11 $ 7.25
Exercise price less than market at grant ........................... 12,650,955 $26.37 $16.80
Total granted 2002 ....................................... 34,152,809 $40.45 $12.51
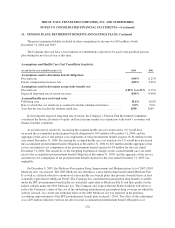
Stock Option Fair Value Information
The fair value effect of stock options is derived by application of a variation of the Black-Scholes option
pricing model.
The significant assumptions used in estimating the fair value on the date of the grant for original options and
reload options granted in 2004, 2003 and 2002 and for the awards assumed on April 1, 2004 from SPC at the
merger and replacement awards issued August 20, 2002 to TPC employees who held Citigroup stock option
awards on that date were as follows:
2004 2003 2002
Expected life of stock options ..................................... 3years 3 years 4 years
Expected volatility of the Company’s stock (1) ....................... 32.1% 29.4% 36.8%
Risk-free interest rate ........................................... 2.5% 2.04% 3.17%
Expected annual dividend per share ................................ $ 0.88 $ 0.60 $ 0.46
Expected annual forfeiture rate .................................... 5% 5% 5%
(1) The expected volatility is based on the average volatility of an industry peer group of entities because the
Company only became publicly traded in March 2002.
173