Travelers 2004 Annual Report Download - page 82
Download and view the complete annual report
Please find page 82 of the 2004 Travelers annual report below. You can navigate through the pages in the report by either clicking on the pages listed below, or by using the keyword search tool below to find specific information within the annual report.-
 1
1 -
2
-
3
-
4
-
5
-
6
-
7
-
8
-
9
-
10
-
11
-
12
-
13
-
14
-
15
-
16
-
17
-
18
-
19
-
20
-
21
-
22
-
23
-
24
-
25
-
26
-
27
-
28
-
29
-
30
-
31
-
32
-
33
-
34
-
35
-
36
-
37
-
38
-
39
-
40
-
41
-
42
-
43
-
44
-
45
-
46
-
47
-
48
-
49
-
50
-
51
-
52
-
53
-
54
-
55
-
56
-
57
-
58
-
59
-
60
-
61
-
62
-
63
-
64
-
65
-
66
-
67
-
68
-
69
-
70
-
71
-
 72
72 -
 73
73 -
 74
74 -
 75
75 -
 76
76 -
 77
77 -
 78
78 -
 79
79 -
 80
80 -
 81
81 -
 82
82 -
 83
83 -
 84
84 -
 85
85 -
 86
86 -
 87
87 -
 88
88 -
 89
89 -
 90
90 -
 91
91 -
 92
92 -
93
-
94
-
95
-
96
-
97
-
98
-
99
-
100
-
101
-
102
-
103
-
104
-
105
-
106
-
107
-
108
-
109
-
110
-
111
-
112
-
113
-
114
-
115
-
116
-
117
-
118
-
119
-
120
-
121
-
122
-
123
-
124
-
125
-
126
-
127
-
128
-
129
-
130
-
131
-
132
-
133
-
134
-
135
-
136
-
137
-
138
-
139
-
140
-
141
-
142
-
143
-
144
-
145
-
146
-
147
-
148
-
149
-
150
-
151
-
152
-
153
-
154
-
155
-
156
-
157
-
158
-
159
-
160
-
161
-
162
-
163
-
164
-
165
-
166
-
167
-
168
-
169
-
170
-
171
-
172
-
173
-
174
-
175
-
176
-
177
-
178
-
179
-
180
-
181
-
182
-
183
-
184
-
185
-
186
-
187
-
188
-
189
-
190
-
191
-
192
-
193
-
194
-
195
-
196
-
197
-
198
-
199
-
200
-
201
-
202
-
203
-
204
-
205
-
206
-
207
-
208
-
209
-
210
-
211
-
212
-
213
-
214
-
215
-
216
-
217
-
218
-
219
-
220
-
221
-
222
-
223
-
224
-
225
-
226
-
227
-
228
-
229
-
230
-
231
-
232
-
233
-
234
-
235
-
236
-
237
-
238
-
239
-
240
 |
 |

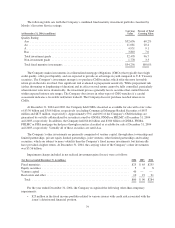
The amortization of deferred acquisition costs, which totaled $800 million in 2003, increased $63 million, or
9%, over 2002 due to higher commission and premium taxes associated with the increases in earned premium
previously described. General and administrative expenses in 2003 also increased 9% over 2002, driven by
business growth and higher commissions that resulted from improved underwriting results.
The 4.5 point improvement in the loss and loss adjustment expense ratio over 2002 was due to renewal price
increases that exceeded loss cost trends, continued reduced levels of non-catastrophe property claim frequency
and higher favorable prior year reserve development, partially offset by higher catastrophes.
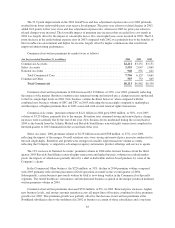
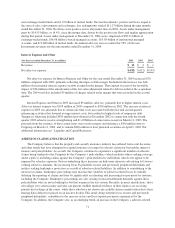
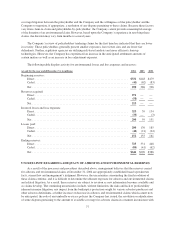
Personal net written premiums by product line were as follows:
(for the year ended December 31, in millions) 2004 2003 2002
Automobile ........................................................... $3,433 $3,054 $2,843
Homeowners and other .................................................. 2,496 2,027 1,732
Total ............................................................ $5,929 $5,081 $4,575
Net written premiums in 2004 increased 17% over 2003. Both Automobile and Homeowners and other net
written premiums increased in 2004 due to higher organic new business volumes, the impact of new business
associated with the Royal & SunAlliance renewal rights transaction completed in the third quarter of 2003,
continued strong retention, and renewal price increases. The Personal segment had approximately 6.1 million, 5.4
million and 5.2 million policies in force at December 31, 2004, 2003 and 2002, respectively.
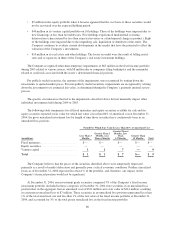
In the Automobile line of business, policies in force at December 31, 2004 increased 9% over 2003. Policies
in force in the Homeowners and other line of business at December 31, 3004 increased by 15% over 2003.
Effective in the first quarter of 2004, Homeowners and other policies in force exclude certain endorsements to
Homeowners policies previously considered separate policies in force. Policy totals for 2003 and 2002 were
restated to conform to the 2004 presentation.
Automobile net written premiums in 2003 increased $211 million, or 7%, over 2002 due to higher business
volumes and renewal price increases. Policies in force at December 31, 2003 increased 4% over 2002.
Homeowners and Other net written premiums increased $295 million, or 17%, in 2003 due to higher
business volumes and renewal price increases. Policies in force increased 6% in 2003.
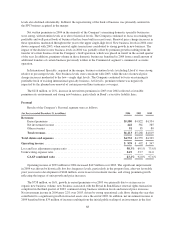
Asset Management
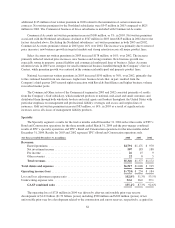
Nuveen Investments’ key financial data were as follows:
(for the nine months ended December 31, in millions) 2004
Revenues ......................................................................... $ 390
Expenses .......................................................................... 199
Pretax income, as reported by Nuveen Investments .................................. 191
Net amortization of the fair value adjustment to intangibles .................................. 9
Pretax income, before minority interest ............................................ $ 182
Asset Management net income, net of minority interest .............................. $88
Assets under management ....................................................... $115,453
Nuveen Investments’ total revenues of $390 million in 2004, from the SPC and TPC merger date, were
driven by continued strong growth in assets under management. Gross sales of investment products totaled
$19.86 billion, consisting of $16.76 billion of retail and institutional managed accounts, $1.87 billion of closed-
70