Travelers 2004 Annual Report Download - page 83
Download and view the complete annual report
Please find page 83 of the 2004 Travelers annual report below. You can navigate through the pages in the report by either clicking on the pages listed below, or by using the keyword search tool below to find specific information within the annual report.-
 1
1 -
2
-
3
-
4
-
5
-
6
-
7
-
8
-
9
-
10
-
11
-
12
-
13
-
14
-
15
-
16
-
17
-
18
-
19
-
20
-
21
-
22
-
23
-
24
-
25
-
26
-
27
-
28
-
29
-
30
-
31
-
32
-
33
-
34
-
35
-
36
-
37
-
38
-
39
-
40
-
41
-
42
-
43
-
44
-
45
-
46
-
47
-
48
-
49
-
50
-
51
-
52
-
53
-
54
-
55
-
56
-
57
-
58
-
59
-
60
-
61
-
62
-
63
-
64
-
65
-
66
-
67
-
68
-
69
-
70
-
71
-
72
-
 73
73 -
 74
74 -
 75
75 -
 76
76 -
 77
77 -
 78
78 -
 79
79 -
 80
80 -
 81
81 -
 82
82 -
 83
83 -
 84
84 -
 85
85 -
 86
86 -
 87
87 -
 88
88 -
 89
89 -
 90
90 -
 91
91 -
 92
92 -
 93
93 -
94
-
95
-
96
-
97
-
98
-
99
-
100
-
101
-
102
-
103
-
104
-
105
-
106
-
107
-
108
-
109
-
110
-
111
-
112
-
113
-
114
-
115
-
116
-
117
-
118
-
119
-
120
-
121
-
122
-
123
-
124
-
125
-
126
-
127
-
128
-
129
-
130
-
131
-
132
-
133
-
134
-
135
-
136
-
137
-
138
-
139
-
140
-
141
-
142
-
143
-
144
-
145
-
146
-
147
-
148
-
149
-
150
-
151
-
152
-
153
-
154
-
155
-
156
-
157
-
158
-
159
-
160
-
161
-
162
-
163
-
164
-
165
-
166
-
167
-
168
-
169
-
170
-
171
-
172
-
173
-
174
-
175
-
176
-
177
-
178
-
179
-
180
-
181
-
182
-
183
-
184
-
185
-
186
-
187
-
188
-
189
-
190
-
191
-
192
-
193
-
194
-
195
-
196
-
197
-
198
-
199
-
200
-
201
-
202
-
203
-
204
-
205
-
206
-
207
-
208
-
209
-
210
-
211
-
212
-
213
-
214
-
215
-
216
-
217
-
218
-
219
-
220
-
221
-
222
-
223
-
224
-
225
-
226
-
227
-
228
-
229
-
230
-
231
-
232
-
233
-
234
-
235
-
236
-
237
-
238
-
239
-
240
 |
 |

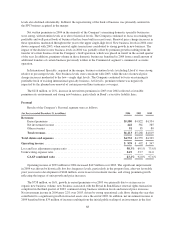
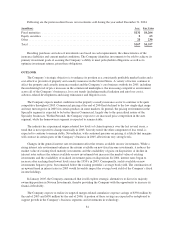
end exchange-traded funds and $1.23 billion of mutual funds. Nuveen Investments’ positive net flows (equal to
the sum of sales, reinvestments and exchanges, less redemptions) totaled $11.23 billion during the nine months
ended December 31, 2004. Net flows were positive across all product lines in 2004. Assets under management
grew by $14.53 billion, or 14.4%, since the merger date, driven by the positive net flows and market appreciation
during that period. Assets under management at December 31, 2004 were comprised of $50.21 billion of
exchange-traded funds, $36.98 billion of retail managed accounts, $15.58 billion of institutional managed
accounts, and $12.68 billion of mutual funds. Investment advisory fees accounted for 93% of Nuveen
Investments revenues for the nine months ended December 31, 2004.
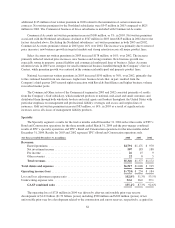
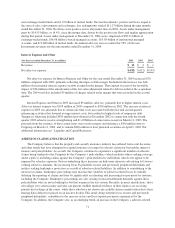
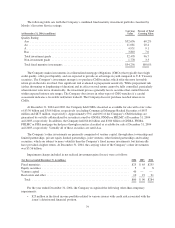
Interest Expense and Other
(for the year ended December 31, in millions) 2004 2003 2002
Revenues ............................................................... $14 $2$1
Net after-tax expense ...................................................... $(182) $(112) $(103)
Net after-tax expense for Interest Expense and Other for the year ended December 31, 2004 increased $70
million compared with 2003, primarily reflecting the impact of the merger. Included in the increase was $46
million of incremental interest expense on debt assumed in the merger. That amount was net of the favorable
impact of $36 million of the amortization of the fair value adjustment related to debt recorded at the acquisition
date. The 2004 total also included $9 million of charges related to the merger that were recorded in the second
quarter.
Interest Expense and Other in 2003 increased $9 million, after tax, primarily due to higher interest costs.
After-tax interest expense was $105 million in 2003 compared to $100 million in 2002. The increase in interest
expense in 2003 was primarily due to certain one time costs associated with the first and second quarter
refinancing activities that lowered average interest costs, but resulted in higher levels of temporary debt.
Temporary financing included $550 million first obtained in December 2002 in connection with the fourth
quarter 2002 asbestos reserve strengthening and $1.40 billion of senior notes issued on March 11, 2003. The
proceeds from the issuance of these senior notes were used to prepay and refinance a $500 million note to
Citigroup on March 11, 2003, and to redeem $900 million of trust preferred securities on April 9, 2003. For
additional information see “Liquidity and Capital Resources.”
ASBESTOS CLAIMS AND LITIGATION
The Company believes that the property and casualty insurance industry has suffered from court decisions
and other trends that have attempted to expand insurance coverage for asbestos claims far beyond the intent of
insurers and policyholders. As a result, the Company continues to experience a significant number of asbestos
claims being tendered to the Company by the Company’s policyholders (which includes others seeking coverage
under a policy) including claims against the Company’s policyholders by individuals who do not appear to be
impaired by asbestos exposure. Factors underlying these increases include more intensive advertising by lawyers
seeking asbestos claimants, the increasing focus by plaintiffs on new and previously peripheral defendants and
entities seeking bankruptcy protection as a result of asbestos-related liabilities. In addition to contributing to the
increase in claims, bankruptcy proceedings may increase the volatility of asbestos-related losses by initially
delaying the reporting of claims and later by significantly accelerating and increasing loss payments by insurers,
including the Company. Bankruptcy proceedings are also causing increased settlement demands against those
policyholders who are not in bankruptcy but that remain in the tort system. Recently, in many jurisdictions, those
who allege very serious injury and who can present credible medical evidence of their injuries are receiving
priority trial settings in the courts, while those who have not shown any credible disease manifestation have their
hearing dates delayed or placed on an inactive docket. This trend, along with the focus on new and previously
peripheral defendants, contributes to the increase in loss and loss expense payments experienced by the
Company. In addition, the Company sees, as an emerging trend, an increase in the Company’s asbestos-related
71