Travelers 2004 Annual Report Download - page 163
Download and view the complete annual report
Please find page 163 of the 2004 Travelers annual report below. You can navigate through the pages in the report by either clicking on the pages listed below, or by using the keyword search tool below to find specific information within the annual report.-
 1
1 -
2
-
3
-
4
-
5
-
6
-
7
-
8
-
9
-
10
-
11
-
12
-
13
-
14
-
15
-
16
-
17
-
18
-
19
-
20
-
21
-
22
-
23
-
24
-
25
-
26
-
27
-
28
-
29
-
30
-
31
-
32
-
33
-
34
-
35
-
36
-
37
-
38
-
39
-
40
-
41
-
42
-
43
-
44
-
45
-
46
-
47
-
48
-
49
-
50
-
51
-
52
-
53
-
54
-
55
-
56
-
57
-
58
-
59
-
60
-
61
-
62
-
63
-
64
-
65
-
66
-
67
-
68
-
69
-
70
-
71
-
72
-
73
-
74
-
75
-
76
-
77
-
78
-
79
-
80
-
81
-
82
-
83
-
84
-
85
-
86
-
87
-
88
-
89
-
90
-
91
-
92
-
93
-
94
-
95
-
96
-
97
-
98
-
99
-
100
-
101
-
102
-
103
-
104
-
105
-
106
-
107
-
108
-
109
-
110
-
111
-
112
-
113
-
114
-
115
-
116
-
117
-
118
-
119
-
120
-
121
-
122
-
123
-
124
-
125
-
126
-
127
-
128
-
129
-
130
-
131
-
132
-
133
-
134
-
135
-
136
-
137
-
138
-
139
-
140
-
141
-
142
-
143
-
144
-
145
-
146
-
147
-
148
-
149
-
150
-
151
-
152
-
 153
153 -
 154
154 -
 155
155 -
 156
156 -
 157
157 -
 158
158 -
 159
159 -
 160
160 -
 161
161 -
 162
162 -
 163
163 -
 164
164 -
 165
165 -
 166
166 -
 167
167 -
 168
168 -
 169
169 -
 170
170 -
 171
171 -
 172
172 -
 173
173 -
174
-
175
-
176
-
177
-
178
-
179
-
180
-
181
-
182
-
183
-
184
-
185
-
186
-
187
-
188
-
189
-
190
-
191
-
192
-
193
-
194
-
195
-
196
-
197
-
198
-
199
-
200
-
201
-
202
-
203
-
204
-
205
-
206
-
207
-
208
-
209
-
210
-
211
-
212
-
213
-
214
-
215
-
216
-
217
-
218
-
219
-
220
-
221
-
222
-
223
-
224
-
225
-
226
-
227
-
228
-
229
-
230
-
231
-
232
-
233
-
234
-
235
-
236
-
237
-
238
-
239
-
240
 |
 |

THE ST. PAUL TRAVELERS COMPANIES, INC. AND SUBSIDIARIES
NOTES TO CONSOLIDATED FINANCIAL STATEMENTS—(Continued)
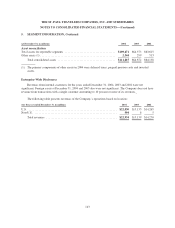
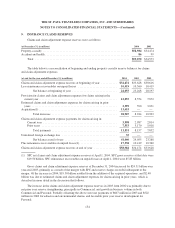
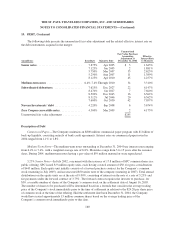
7. EARNINGS PER SHARE, Continued
The following is a reconciliation of the income and share data used in the basic and diluted earnings per
share computations:
(for the year ended December 31, in millions, except per share amounts) 2004 2003 2002
Basic
Net income (loss), as reported ............................................ $ 955 $1,696 $ (27)
Preferred stock dividends, net of taxes ..................................... (6) ——
Net income (loss) available to common shareholders ...................... $ 949 $1,696 $ (27)
Diluted
Net income (loss) available to common shareholders .......................... $ 949 $1,696 $ (27)
Effect of dilutive securities:
Dilutive affect of affiliates ........................................... (3) ——
Equity unit stock purchase contracts ................................... 12 ——
Convertible preferred stock .......................................... 4——
Zero coupon convertible notes ........................................ 2——
Convertible junior subordinated notes .................................. —26 —
Net income (loss) available to common shareholders ...................... $ 964 $1,722 $ (27)
Common Shares
Basic
Weighted average shares outstanding ...................................... 608.3 434.3 411.5
Diluted
Weighted average shares outstanding ...................................... 608.3 434.3 411.5
Weighted average effects of dilutive securities:
Stock options and other incentive plans ................................. 2.9 2.3 0.8
Equity unit stock purchase contracts ................................... 11.5 ——
Convertible preferred stock .......................................... 3.8 ——
Zero coupon convertible notes ........................................ 1.8 ——
Convertible junior subordinated notes .................................. —16.7 —
Total ........................................................ 628.3 453.3 412.3
Net Income (Loss) Per Common Share
Basic ................................................................ $ 1.56 $ 3.91 $ (0.07)
Diluted .............................................................. $ 1.53 $ 3.80 $ (0.07)
151