Travelers 2004 Annual Report Download - page 157
Download and view the complete annual report
Please find page 157 of the 2004 Travelers annual report below. You can navigate through the pages in the report by either clicking on the pages listed below, or by using the keyword search tool below to find specific information within the annual report.-
 1
1 -
2
-
3
-
4
-
5
-
6
-
7
-
8
-
9
-
10
-
11
-
12
-
13
-
14
-
15
-
16
-
17
-
18
-
19
-
20
-
21
-
22
-
23
-
24
-
25
-
26
-
27
-
28
-
29
-
30
-
31
-
32
-
33
-
34
-
35
-
36
-
37
-
38
-
39
-
40
-
41
-
42
-
43
-
44
-
45
-
46
-
47
-
48
-
49
-
50
-
51
-
52
-
53
-
54
-
55
-
56
-
57
-
58
-
59
-
60
-
61
-
62
-
63
-
64
-
65
-
66
-
67
-
68
-
69
-
70
-
71
-
72
-
73
-
74
-
75
-
76
-
77
-
78
-
79
-
80
-
81
-
82
-
83
-
84
-
85
-
86
-
87
-
88
-
89
-
90
-
91
-
92
-
93
-
94
-
95
-
96
-
97
-
98
-
99
-
100
-
101
-
102
-
103
-
104
-
105
-
106
-
107
-
108
-
109
-
110
-
111
-
112
-
113
-
114
-
115
-
116
-
117
-
118
-
119
-
120
-
121
-
122
-
123
-
124
-
125
-
126
-
127
-
128
-
129
-
130
-
131
-
132
-
133
-
134
-
135
-
136
-
137
-
138
-
139
-
140
-
141
-
142
-
143
-
144
-
145
-
146
-
 147
147 -
 148
148 -
 149
149 -
 150
150 -
 151
151 -
 152
152 -
 153
153 -
 154
154 -
 155
155 -
 156
156 -
 157
157 -
 158
158 -
 159
159 -
 160
160 -
 161
161 -
 162
162 -
 163
163 -
 164
164 -
 165
165 -
 166
166 -
 167
167 -
168
-
169
-
170
-
171
-
172
-
173
-
174
-
175
-
176
-
177
-
178
-
179
-
180
-
181
-
182
-
183
-
184
-
185
-
186
-
187
-
188
-
189
-
190
-
191
-
192
-
193
-
194
-
195
-
196
-
197
-
198
-
199
-
200
-
201
-
202
-
203
-
204
-
205
-
206
-
207
-
208
-
209
-
210
-
211
-
212
-
213
-
214
-
215
-
216
-
217
-
218
-
219
-
220
-
221
-
222
-
223
-
224
-
225
-
226
-
227
-
228
-
229
-
230
-
231
-
232
-
233
-
234
-
235
-
236
-
237
-
238
-
239
-
240
 |
 |

THE ST. PAUL TRAVELERS COMPANIES, INC. AND SUBSIDIARIES
NOTES TO CONSOLIDATED FINANCIAL STATEMENTS—(Continued)
6. INVESTMENTS, Continued
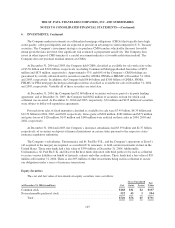
The Company makes investments in collateralized mortgage obligations (CMOs) that typically have high
credit quality, offer good liquidity and are expected to provide an advantage in yield compared to U.S. Treasury
securities. The Company’s investment strategy is to purchase CMO tranches which offer the most favorable
return given the risks involved. One significant risk evaluated is prepayment sensitivity. The Company does
invest in other types of CMO tranches if a careful assessment indicates a favorable risk/return tradeoff. The
Company does not purchase residual interests in CMOs.
At December 31, 2004 and 2003, the Company held CMOs classified as available for sale with a fair value
of $3.30 billion and $3.06 billion, respectively (excluding Commercial Mortgage-Backed Securities of $953
million and $875 million, respectively). Approximately 53% and 60% of the Company’s CMO holdings are
guaranteed by or fully collateralized by securities issued by GNMA, FNMA or FHLMC at December 31, 2004
and 2003, respectively. In addition, the Company held $4.66 billion and $3.80 billion of GNMA, FNMA,
FHLMC or FHA mortgage-backed pass-through securities classified as available for sale at December 31, 2004
and 2003, respectively. Virtually all of these securities are rated Aaa.
At December 31, 2004, the Company had $2.60 billion of securities on loan as part of a tri-party lending
agreement, and at December 31, 2003, the Company had $562 million of securities on loan for which cash
collateral was received. At December 31, 2004 and 2003, respectively, $32 million and $135 million of securities
were subject to dollar-roll repurchase agreements.
Proceeds from sales of fixed maturities classified as available for sale were $7.95 billion, $8.34 billion and
$12.52 billion in 2004, 2003 and 2002, respectively. Gross gains of $202 million, $282 million and $571 million
and gross losses of $126 million, $147 million and $148 million were realized on those sales in 2004, 2003 and
2002, respectively.
At December 31, 2004 and 2003, the Company’s insurance subsidiaries had $3.39 billion and $2.37 billion,
respectively, of securities on deposit at financial institutions in certain states pursuant to the respective states’
insurance regulatory authorities.
The Company’s subsidiaries, Unionamerica and St. Paul Re-U.K., and the Company’s operations at Lloyd’s
(all acquired in the merger) are required, as accredited U.S. reinsurers, to hold certain investments in trust in the
United States. These trust funds had a fair value of $359 million at December 31, 2004. Additionally,
Unionamerica, St. Paul Re-U.K. and Discover Re have funds deposited with third parties to be used as collateral
to secure various liabilities on behalf of insureds, cedants and other creditors. These funds had a fair value of $55
million at December 31, 2004. There is also $95 million of other investments being used as collateral to secure
our obligations under a series of insurance transactions.
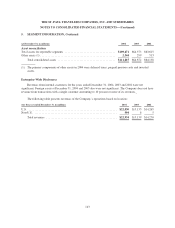
Equity Securities
The cost and fair value of investments in equity securities were as follows:
(at December 31, 2004, in millions) Cost
Gross Unrealized Fair
ValueGains Losses
Common stock ..................................................... $168 $31 $2 $197
Non-redeemable preferred stock ....................................... 552 45 3 594
Total ......................................................... $720 $76 $5 $791
145