Travelers 2004 Annual Report Download - page 66
Download and view the complete annual report
Please find page 66 of the 2004 Travelers annual report below. You can navigate through the pages in the report by either clicking on the pages listed below, or by using the keyword search tool below to find specific information within the annual report.-
 1
1 -
2
-
3
-
4
-
5
-
6
-
7
-
8
-
9
-
10
-
11
-
12
-
13
-
14
-
15
-
16
-
17
-
18
-
19
-
20
-
21
-
22
-
23
-
24
-
25
-
26
-
27
-
28
-
29
-
30
-
31
-
32
-
33
-
34
-
35
-
36
-
37
-
38
-
39
-
40
-
41
-
42
-
43
-
44
-
45
-
46
-
47
-
48
-
49
-
50
-
51
-
52
-
53
-
54
-
55
-
 56
56 -
 57
57 -
 58
58 -
 59
59 -
 60
60 -
 61
61 -
 62
62 -
 63
63 -
 64
64 -
 65
65 -
 66
66 -
 67
67 -
 68
68 -
 69
69 -
 70
70 -
 71
71 -
 72
72 -
 73
73 -
 74
74 -
 75
75 -
 76
76 -
77
-
78
-
79
-
80
-
81
-
82
-
83
-
84
-
85
-
86
-
87
-
88
-
89
-
90
-
91
-
92
-
93
-
94
-
95
-
96
-
97
-
98
-
99
-
100
-
101
-
102
-
103
-
104
-
105
-
106
-
107
-
108
-
109
-
110
-
111
-
112
-
113
-
114
-
115
-
116
-
117
-
118
-
119
-
120
-
121
-
122
-
123
-
124
-
125
-
126
-
127
-
128
-
129
-
130
-
131
-
132
-
133
-
134
-
135
-
136
-
137
-
138
-
139
-
140
-
141
-
142
-
143
-
144
-
145
-
146
-
147
-
148
-
149
-
150
-
151
-
152
-
153
-
154
-
155
-
156
-
157
-
158
-
159
-
160
-
161
-
162
-
163
-
164
-
165
-
166
-
167
-
168
-
169
-
170
-
171
-
172
-
173
-
174
-
175
-
176
-
177
-
178
-
179
-
180
-
181
-
182
-
183
-
184
-
185
-
186
-
187
-
188
-
189
-
190
-
191
-
192
-
193
-
194
-
195
-
196
-
197
-
198
-
199
-
200
-
201
-
202
-
203
-
204
-
205
-
206
-
207
-
208
-
209
-
210
-
211
-
212
-
213
-
214
-
215
-
216
-
217
-
218
-
219
-
220
-
221
-
222
-
223
-
224
-
225
-
226
-
227
-
228
-
229
-
230
-
231
-
232
-
233
-
234
-
235
-
236
-
237
-
238
-
239
-
240
 |
 |

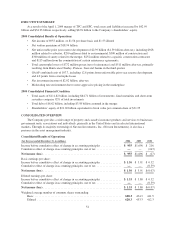
EXECUTIVE SUMMARY
As a result of the April 1, 2004 merger of TPC and SPC, total assets and liabilities increased by $42.99
billion and $34.23 billion, respectively, adding $8.76 billion to the Company’s shareholders’ equity.
2004 Consolidated Results of Operations
• Net income of $955 million, or $1.56 per share basic and $1.53 diluted
• Net written premiums of $18.94 billion
• Net unfavorable prior year reserve development of $2.39 billion ($1.59 billion after-tax), including $928
million related to asbestos, $290 million related to environmental, $500 million of construction and
$300 million of surety related to the merger, $252 million related to a specific construction contractor
and $113 million from the commutation of certain reinsurance agreements.
• Total catastrophe losses of $772 million pretax (net of reinsurance) and $511 million after-tax, primarily
resulting from Hurricanes Charley, Frances, Ivan and Jeanne in the third quarter
• GAAP combined ratio of 107.7, including 12.6 points from unfavorable prior year reserve development
and 4.0 points from catastrophe losses
• Net investment income of $2.02 billion, after-tax
• Moderating rate environment due to more aggressive pricing in the marketplace
2004 Consolidated Financial Condition
• Total assets of $111.82 billion, including $64.71 billion of investments; fixed maturities and short-term
securities comprise 92% of total investments
• Total debt of $6.62 billion, including $3.98 billion assumed in the merger
• Shareholders’ equity of $21.20 billion, equivalent to book value per common share of $31.35
CONSOLIDATED OVERVIEW
The Company provides a wide range of property and casualty insurance products and services to businesses,
government units, associations and individuals, primarily in the United States and in selected international
markets. Through its majority ownership of Nuveen Investments, Inc. (Nuveen Investments), it also has a
presence in the asset management industry.
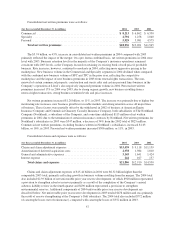
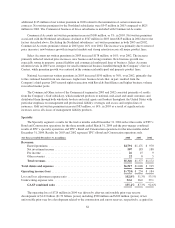
Consolidated Results of Operations
(for the year ended December 31, in millions) 2004 2003 2002
Income before cumulative effect of change in accounting principles .............. $ 955 $1,696 $ 216
Cumulative effect of change in accounting principles, net of tax ................. —— (243)
Net income (loss) ...................................................... $ 955 $1,696 $ (27)
Basic earnings per share:
Income before cumulative effect of change in accounting principles .............. $ 1.56 $ 3.91 $ 0.52
Cumulative effect of change in accounting principles, net of tax ................. —— (0.59)
Net income (loss) ...................................................... $ 1.56 $ 3.91 $ (0.07)
Diluted earnings per share:
Income before cumulative effect of change in accounting principles .............. $ 1.53 $ 3.80 $ 0.52
Cumulative effect of change in accounting principles, net of tax ................. —— (0.59)
Net income (loss) ...................................................... $ 1.53 $ 3.80 $ (0.07)
Weighted average number of common shares outstanding:
Basic ............................................................ 608.3 434.3 411.5
Diluted .......................................................... 628.3 453.3 412.3
54