Travelers 2004 Annual Report Download - page 153
Download and view the complete annual report
Please find page 153 of the 2004 Travelers annual report below. You can navigate through the pages in the report by either clicking on the pages listed below, or by using the keyword search tool below to find specific information within the annual report.-
 1
1 -
2
-
3
-
4
-
5
-
6
-
7
-
8
-
9
-
10
-
11
-
12
-
13
-
14
-
15
-
16
-
17
-
18
-
19
-
20
-
21
-
22
-
23
-
24
-
25
-
26
-
27
-
28
-
29
-
30
-
31
-
32
-
33
-
34
-
35
-
36
-
37
-
38
-
39
-
40
-
41
-
42
-
43
-
44
-
45
-
46
-
47
-
48
-
49
-
50
-
51
-
52
-
53
-
54
-
55
-
56
-
57
-
58
-
59
-
60
-
61
-
62
-
63
-
64
-
65
-
66
-
67
-
68
-
69
-
70
-
71
-
72
-
73
-
74
-
75
-
76
-
77
-
78
-
79
-
80
-
81
-
82
-
83
-
84
-
85
-
86
-
87
-
88
-
89
-
90
-
91
-
92
-
93
-
94
-
95
-
96
-
97
-
98
-
99
-
100
-
101
-
102
-
103
-
104
-
105
-
106
-
107
-
108
-
109
-
110
-
111
-
112
-
113
-
114
-
115
-
116
-
117
-
118
-
119
-
120
-
121
-
122
-
123
-
124
-
125
-
126
-
127
-
128
-
129
-
130
-
131
-
132
-
133
-
134
-
135
-
136
-
137
-
138
-
139
-
140
-
141
-
142
-
 143
143 -
 144
144 -
 145
145 -
 146
146 -
 147
147 -
 148
148 -
 149
149 -
 150
150 -
 151
151 -
 152
152 -
 153
153 -
 154
154 -
 155
155 -
 156
156 -
 157
157 -
 158
158 -
 159
159 -
 160
160 -
 161
161 -
 162
162 -
 163
163 -
164
-
165
-
166
-
167
-
168
-
169
-
170
-
171
-
172
-
173
-
174
-
175
-
176
-
177
-
178
-
179
-
180
-
181
-
182
-
183
-
184
-
185
-
186
-
187
-
188
-
189
-
190
-
191
-
192
-
193
-
194
-
195
-
196
-
197
-
198
-
199
-
200
-
201
-
202
-
203
-
204
-
205
-
206
-
207
-
208
-
209
-
210
-
211
-
212
-
213
-
214
-
215
-
216
-
217
-
218
-
219
-
220
-
221
-
222
-
223
-
224
-
225
-
226
-
227
-
228
-
229
-
230
-
231
-
232
-
233
-
234
-
235
-
236
-
237
-
238
-
239
-
240
 |
 |

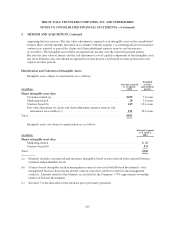
THE ST. PAUL TRAVELERS COMPANIES, INC. AND SUBSIDIARIES
NOTES TO CONSOLIDATED FINANCIAL STATEMENTS—(Continued)
5. SEGMENT INFORMATION, Continued
The following tables summarize the components of the Company’s revenues, operating income (loss) and
total assets by reportable business segments:
(at and for the year ended December 31, in millions) Commercial Specialty Personal
Asset
Management
Total
Reportable
Segments
2004 Revenues
Premiums ................................. $ 8,667 $ 4,791 $ 5,580 $ — $ 19,038
Net investment income ...................... 1,708 507 442 — 2,657
Fee income ............................... 680 26 — — 706
Asset management ......................... — — — 390 390
Other revenues ............................ 55 22 91 — 168
Total operating revenues (1) .................. $11,110 $ 5,346 $ 6,113 $ 390 $ 22,959
Amortization and depreciation ................ $ 1,244 $ 772 $ 952 $ 12 $ 2,980
Income tax expense (benefit) ................. 173 (447) 442 69 237
Operating income (loss) (1) .................. 862 (724) 939 88 1,165
Assets ................................... $67,454 $27,551 $11,813 $2,653 $109,471
2003 Revenues
Premiums ................................. $ 6,552 $ 1,171 $ 4,822 $ — $ 12,545
Net investment income ...................... 1,324 183 361 — 1,868
Fee income ............................... 545 15 — — 560
Other revenues ............................ 33 8 85 — 126
Total operating revenues (1) .................. $ 8,454 $ 1,377 $ 5,268 $ — $ 15,099
Amortization and depreciation ................ $ 996 $ 245 $ 810 $ — $ 2,051
Income tax expense ......................... 268 95 221 — 584
Operating income (1) ....................... 1,061 234 492 — 1,787
Assets ................................... n/a(2) n/a(2) n/a(2) — $ 64,573
2002 Revenues
Premiums ................................. $ 5,831 $ 970 $ 4,354 $ — $ 11,155
Net investment income ...................... 1,307 188 385 — 1,880
Fee income ............................... 446 9 — — 455
Recoveries from former affiliate ............... 520 — — — 520
Other revenues ............................ 28 4 80 — 112
Total operating revenues (1) .................. $ 8,132 $ 1,171 $ 4,819 $ — $ 14,122
Amortization and depreciation ................ $ 898 $ 215 $ 739 $ — $ 1,852
Income tax expense (benefit) ................. (685) 76 143 — (466)
Operating income (loss) (1) .................. (310) 184 347 — 221
Assets ................................... n/a(2) n/a(2) n/a(2) — $ 63,625
(1) Operating revenues exclude net realized investment gains (losses). Operating income (loss) equals net
income (loss) excluding the after-tax impact of net realized investment gains (losses) and cumulative effect
of changes in accounting principles when applicable. For 2002, operating income also excludes non-
recurring restructuring charges related to periods prior to the spin-off from Citigroup.
(2) It is not practicable to restate assets by segment for prior periods.
141