Travelers 2004 Annual Report Download - page 27
Download and view the complete annual report
Please find page 27 of the 2004 Travelers annual report below. You can navigate through the pages in the report by either clicking on the pages listed below, or by using the keyword search tool below to find specific information within the annual report.-
 1
1 -
2
-
3
-
4
-
5
-
6
-
7
-
8
-
9
-
10
-
11
-
12
-
13
-
14
-
15
-
16
-
 17
17 -
 18
18 -
 19
19 -
 20
20 -
 21
21 -
 22
22 -
 23
23 -
 24
24 -
 25
25 -
 26
26 -
 27
27 -
 28
28 -
 29
29 -
 30
30 -
 31
31 -
 32
32 -
 33
33 -
 34
34 -
 35
35 -
 36
36 -
 37
37 -
38
-
39
-
40
-
41
-
42
-
43
-
44
-
45
-
46
-
47
-
48
-
49
-
50
-
51
-
52
-
53
-
54
-
55
-
56
-
57
-
58
-
59
-
60
-
61
-
62
-
63
-
64
-
65
-
66
-
67
-
68
-
69
-
70
-
71
-
72
-
73
-
74
-
75
-
76
-
77
-
78
-
79
-
80
-
81
-
82
-
83
-
84
-
85
-
86
-
87
-
88
-
89
-
90
-
91
-
92
-
93
-
94
-
95
-
96
-
97
-
98
-
99
-
100
-
101
-
102
-
103
-
104
-
105
-
106
-
107
-
108
-
109
-
110
-
111
-
112
-
113
-
114
-
115
-
116
-
117
-
118
-
119
-
120
-
121
-
122
-
123
-
124
-
125
-
126
-
127
-
128
-
129
-
130
-
131
-
132
-
133
-
134
-
135
-
136
-
137
-
138
-
139
-
140
-
141
-
142
-
143
-
144
-
145
-
146
-
147
-
148
-
149
-
150
-
151
-
152
-
153
-
154
-
155
-
156
-
157
-
158
-
159
-
160
-
161
-
162
-
163
-
164
-
165
-
166
-
167
-
168
-
169
-
170
-
171
-
172
-
173
-
174
-
175
-
176
-
177
-
178
-
179
-
180
-
181
-
182
-
183
-
184
-
185
-
186
-
187
-
188
-
189
-
190
-
191
-
192
-
193
-
194
-
195
-
196
-
197
-
198
-
199
-
200
-
201
-
202
-
203
-
204
-
205
-
206
-
207
-
208
-
209
-
210
-
211
-
212
-
213
-
214
-
215
-
216
-
217
-
218
-
219
-
220
-
221
-
222
-
223
-
224
-
225
-
226
-
227
-
228
-
229
-
230
-
231
-
232
-
233
-
234
-
235
-
236
-
237
-
238
-
239
-
240
 |
 |

homeowners insurance for dwellings, condominiums and rental property contents. The Company also writes
coverage for personal watercraft, personal articles such as jewelry, and umbrella liability protection.
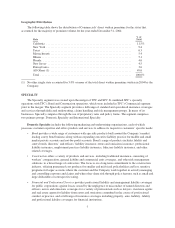
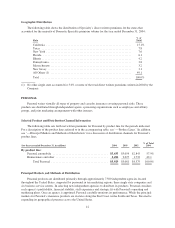
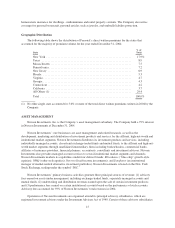
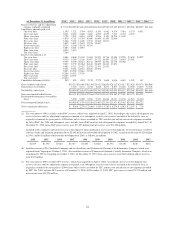
Geographic Distribution
The following table shows the distribution of Personal’s direct written premiums for the states that
accounted for the majority of premium volume for the year ended December 31, 2004:
State
%of
Total
New York ........................................................... 17.9%
Texas .............................................................. 8.9
Massachusetts ........................................................ 7.5
Pennsylvania ......................................................... 7.2
New Jersey .......................................................... 6.9
Florida ............................................................. 5.3
Virginia ............................................................. 4.7
Georgia ............................................................. 4.3
Connecticut .......................................................... 4.2
California ........................................................... 3.7
All Others (1) ........................................................ 29.4
Total ............................................................... 100.0%
(1) No other single state accounted for 3.0% or more of the total direct written premiums written in 2004 by the
Company.
ASSET MANAGEMENT
Nuveen Investments, Inc. is the Company’s asset management subsidiary. The Company held a 79% interest
in Nuveen Investments at December 31, 2004.
Nuveen Investments’ core businesses are asset management and related research, as well as the
development, marketing and distribution of investment products and services for the affluent, high-net-worth and
institutional market segments. Nuveen Investments distributes its investment products and services, including
individually managed accounts, closed-end exchange-traded funds and mutual funds, to the affluent and high-net-
worth market segments through unaffiliated intermediary firms including broker/dealers, commercial banks,
affiliates of insurance providers, financial planners, accountants, consultants and investment advisors. Nuveen
Investments also provides managed account services to several institutional market segments and channels.
Nuveen Investments markets its capabilities under four distinct brands: Rittenhouse (“blue-chip” growth-style
equities); NWQ (value-style equities); Nuveen (fixed-income investments); and Symphony (an institutional
manager of market-neutral alternative investment portfolios). Nuveen Investments is listed on the New York
Stock Exchange, trading under the symbol “JNC.”
Nuveen Investments’ primary business activities generate three principal sources of revenue: (1) advisory
fees earned on assets under management, including exchange-traded funds, separately managed accounts and
mutual funds; (2) underwriting and distribution revenues earned upon the sale of certain investment products;
and (3) performance fees earned on certain institutional accounts based on the performance of such accounts.
Advisory fees accounted for 93% of Nuveen Investments’ total revenues in 2004.
Operations of Nuveen Investments are organized around its principal advisory subsidiaries, which are
registered investment advisors under the Investment Advisers Act of 1940. Certain of these advisory subsidiaries
15