Travelers 2004 Annual Report Download - page 75
Download and view the complete annual report
Please find page 75 of the 2004 Travelers annual report below. You can navigate through the pages in the report by either clicking on the pages listed below, or by using the keyword search tool below to find specific information within the annual report.-
 1
1 -
2
-
3
-
4
-
5
-
6
-
7
-
8
-
9
-
10
-
11
-
12
-
13
-
14
-
15
-
16
-
17
-
18
-
19
-
20
-
21
-
22
-
23
-
24
-
25
-
26
-
27
-
28
-
29
-
30
-
31
-
32
-
33
-
34
-
35
-
36
-
37
-
38
-
39
-
40
-
41
-
42
-
43
-
44
-
45
-
46
-
47
-
48
-
49
-
50
-
51
-
52
-
53
-
54
-
55
-
56
-
57
-
58
-
59
-
60
-
61
-
62
-
63
-
64
-
 65
65 -
 66
66 -
 67
67 -
 68
68 -
 69
69 -
 70
70 -
 71
71 -
 72
72 -
 73
73 -
 74
74 -
 75
75 -
 76
76 -
 77
77 -
 78
78 -
 79
79 -
 80
80 -
 81
81 -
 82
82 -
 83
83 -
 84
84 -
 85
85 -
86
-
87
-
88
-
89
-
90
-
91
-
92
-
93
-
94
-
95
-
96
-
97
-
98
-
99
-
100
-
101
-
102
-
103
-
104
-
105
-
106
-
107
-
108
-
109
-
110
-
111
-
112
-
113
-
114
-
115
-
116
-
117
-
118
-
119
-
120
-
121
-
122
-
123
-
124
-
125
-
126
-
127
-
128
-
129
-
130
-
131
-
132
-
133
-
134
-
135
-
136
-
137
-
138
-
139
-
140
-
141
-
142
-
143
-
144
-
145
-
146
-
147
-
148
-
149
-
150
-
151
-
152
-
153
-
154
-
155
-
156
-
157
-
158
-
159
-
160
-
161
-
162
-
163
-
164
-
165
-
166
-
167
-
168
-
169
-
170
-
171
-
172
-
173
-
174
-
175
-
176
-
177
-
178
-
179
-
180
-
181
-
182
-
183
-
184
-
185
-
186
-
187
-
188
-
189
-
190
-
191
-
192
-
193
-
194
-
195
-
196
-
197
-
198
-
199
-
200
-
201
-
202
-
203
-
204
-
205
-
206
-
207
-
208
-
209
-
210
-
211
-
212
-
213
-
214
-
215
-
216
-
217
-
218
-
219
-
220
-
221
-
222
-
223
-
224
-
225
-
226
-
227
-
228
-
229
-
230
-
231
-
232
-
233
-
234
-
235
-
236
-
237
-
238
-
239
-
240
 |
 |

The 33.9 point improvement in the 2003 GAAP loss and loss adjustment expense ratio over 2002 primarily
resulted from lower unfavorable prior year reserve development. The prior-year asbestos-related charges in 2002
added 36.8 points to that year’s loss and loss adjustment expense ratio, whereas in 2003 no prior-year asbestos-
related charges were incurred. The favorable impact of premium rate increases that exceeded loss cost trends in
2003 was largely offset by the impact of catastrophe losses. No catastrophe losses were incurred in 2002. The 0.6
point decrease in the underwriting expense ratio in 2003 compared with 2002 was primarily due to the benefits of
the favorable rate environment and higher fee income, largely offset by higher commissions that result from
improved underwriting performance.
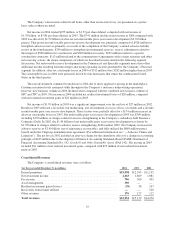
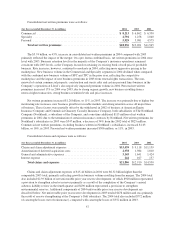
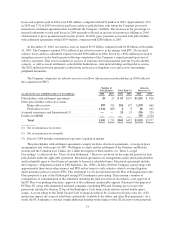
Commercial net written premiums by market were as follows:
(for the year ended December 31, in millions) 2004 2003 2002
Commercial Accounts .................................................. $4,211 $3,251 $3,151
Select Accounts ....................................................... 2,555 2,047 1,869
National Accounts ..................................................... 940 831 641
Total Commercial Core ............................................. 7,706 6,129 5,661
Commercial Other ..................................................... 507 733 669
Total Commercial ................................................. $8,213 $6,862 $6,330
Commercial net written premiums in 2004 increased $1.35 billion, or 20%, over 2003, primarily reflecting
the impact of the merger. Business retention rates remained strong and renewal price change increases moderated
to the low-single digit levels in 2004. New business volume declined, however, when compared with the
combined new business volume of SPC and TPC in 2003, reflecting the increasingly competitive marketplace
and the impact of higher premium flow in 2003 associated with several renewal rights transactions.
Commercial Accounts’ premium volume of $4.21 billion in 2004 grew $960 million, or 30%, over 2003
volume of $3.25 billion, primarily due to the merger. Retention rates remained strong and renewal price change
increases were essentially flat by the end of the year. New business levels moderated during the second half of
2004 as the benefit from the Atlantic Mutual and Royal & SunAlliance renewal rights transactions completed in
the third quarter of 2003 diminished in the second half of the year.
Select Accounts’ 2004 premium volume of $2.56 billion increased $508 million, or 25%, over 2003,
reflecting the impact of the merger. Overall retention rates were strong and renewal price increases moderated to
the mid single-digits. Retention and growth were strongest in smaller, high transaction volume accounts,
reflecting the Company’s competitive advantage in agency automation, product offerings and service to agents.
The 13% increase in National Accounts’ premium volume in 2004 reflected new business from the third-
quarter 2003 Royal & SunAlliance renewal rights transaction and higher business volumes in residual market
pools, the impacts of which were partially offset by a shift to deductible and fee-based products by some of the
Company’s clients.
In the Commercial Other business, the $226 million, or 31%, decline in 2004 premium volume compared
with 2003 primarily reflected the placement of Gulf operations in runoff in the second quarter of 2004.
Subsequently, certain business previously written by Gulf is now being written in the Commercial or Specialty
segments. The runoff healthcare, reinsurance and international business acquired in the merger produced minimal
written premium volume in 2004.
Commercial net written premiums increased $532 million, or 8%, in 2003. Renewal price increases, higher
new business levels, and strong customer retention across all major lines of business combined to drive premium
growth over 2002. This premium growth was partially offset by the decrease in net written premiums at the
Northland subsidiaries due to the withdrawal in 2002 of business at certain of those subsidiaries and a one-time
63