Travelers 2004 Annual Report Download - page 154
Download and view the complete annual report
Please find page 154 of the 2004 Travelers annual report below. You can navigate through the pages in the report by either clicking on the pages listed below, or by using the keyword search tool below to find specific information within the annual report.-
 1
1 -
2
-
3
-
4
-
5
-
6
-
7
-
8
-
9
-
10
-
11
-
12
-
13
-
14
-
15
-
16
-
17
-
18
-
19
-
20
-
21
-
22
-
23
-
24
-
25
-
26
-
27
-
28
-
29
-
30
-
31
-
32
-
33
-
34
-
35
-
36
-
37
-
38
-
39
-
40
-
41
-
42
-
43
-
44
-
45
-
46
-
47
-
48
-
49
-
50
-
51
-
52
-
53
-
54
-
55
-
56
-
57
-
58
-
59
-
60
-
61
-
62
-
63
-
64
-
65
-
66
-
67
-
68
-
69
-
70
-
71
-
72
-
73
-
74
-
75
-
76
-
77
-
78
-
79
-
80
-
81
-
82
-
83
-
84
-
85
-
86
-
87
-
88
-
89
-
90
-
91
-
92
-
93
-
94
-
95
-
96
-
97
-
98
-
99
-
100
-
101
-
102
-
103
-
104
-
105
-
106
-
107
-
108
-
109
-
110
-
111
-
112
-
113
-
114
-
115
-
116
-
117
-
118
-
119
-
120
-
121
-
122
-
123
-
124
-
125
-
126
-
127
-
128
-
129
-
130
-
131
-
132
-
133
-
134
-
135
-
136
-
137
-
138
-
139
-
140
-
141
-
142
-
143
-
 144
144 -
 145
145 -
 146
146 -
 147
147 -
 148
148 -
 149
149 -
 150
150 -
 151
151 -
 152
152 -
 153
153 -
 154
154 -
 155
155 -
 156
156 -
 157
157 -
 158
158 -
 159
159 -
 160
160 -
 161
161 -
 162
162 -
 163
163 -
 164
164 -
165
-
166
-
167
-
168
-
169
-
170
-
171
-
172
-
173
-
174
-
175
-
176
-
177
-
178
-
179
-
180
-
181
-
182
-
183
-
184
-
185
-
186
-
187
-
188
-
189
-
190
-
191
-
192
-
193
-
194
-
195
-
196
-
197
-
198
-
199
-
200
-
201
-
202
-
203
-
204
-
205
-
206
-
207
-
208
-
209
-
210
-
211
-
212
-
213
-
214
-
215
-
216
-
217
-
218
-
219
-
220
-
221
-
222
-
223
-
224
-
225
-
226
-
227
-
228
-
229
-
230
-
231
-
232
-
233
-
234
-
235
-
236
-
237
-
238
-
239
-
240
 |
 |

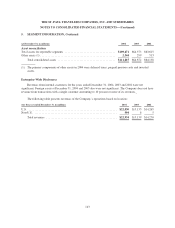
THE ST. PAUL TRAVELERS COMPANIES, INC. AND SUBSIDIARIES
NOTES TO CONSOLIDATED FINANCIAL STATEMENTS—(Continued)
5. SEGMENT INFORMATION, Continued
Business Segment Reconciliations
(at and for the year ended December 31, in millions) 2004 2003 2002
Revenue reconciliation
Earned premiums
Commercial:
Commercial multi-peril ...................................... $ 2,464 $ 2,116 $ 1,830
Workers’ compensation ...................................... 1,499 1,129 894
Commercial automobile ...................................... 1,652 1,323 1,225
Property .................................................. 1,625 1,028 1,012
General liability ............................................ 1,285 806 767
Other ..................................................... 142 150 103
Total Commercial ....................................... 8,667 6,552 5,831
Specialty:
General liability ............................................ 1,470 296 192
Fidelity and surety .......................................... 881 507 438
Workers’ compensation ...................................... 433 107 115
Commercial automobile ...................................... 440 102 86
Property .................................................. 337 16 11
Commercial multi-peril ...................................... 300 141 126
International ............................................... 930 22
Total Specialty ......................................... 4,791 1,171 970
Personal:
Automobile ................................................ 3,320 2,955 2,737
Homeowners and other ....................................... 2,260 1,867 1,617
Total Personal .......................................... 5,580 4,822 4,354
Total earned premiums ................................... 19,038 12,545 11,155
Net investment income ............................................... 2,657 1,868 1,880
Fee income ........................................................ 706 560 455
Recoveries from former affiliates ...................................... —— 520
Other revenues ..................................................... 168 126 112
Total Insurance Operations ................................... 22,569 15,099 14,122
Asset Management .................................................. 390 ——
Total operating revenues for reportable segments .......................... 22,959 15,099 14,122
Interest Expense and Other ........................................... 14 21
Net realized investment gains (losses) ................................... (39) 38 147
Total consolidated revenues ................................... $22,934 $15,139 $14,270
Income reconciliation, net of tax and minority interest
Total operating income for reportable segments ........................... $ 1,165 $ 1,787 $ 221
Interest Expense and Other (1) ......................................... (182) (112) (103)
Total operating income ....................................... 983 1,675 118
Net realized investment gains (losses) ................................... (28) 21 99
Cumulative effect of changes in accounting principles ...................... —— (242)
Restructuring charge ................................................ —— (2)
Total consolidated net income (loss) ............................ $ 955 $ 1,696 $ (27)
(1) The primary component of Interest Expense and Other is after-tax interest expense of $151 million, $105
million and $100 million in 2004, 2003 and 2002, respectively.
142