Travelers 2004 Annual Report Download - page 160
Download and view the complete annual report
Please find page 160 of the 2004 Travelers annual report below. You can navigate through the pages in the report by either clicking on the pages listed below, or by using the keyword search tool below to find specific information within the annual report.-
 1
1 -
2
-
3
-
4
-
5
-
6
-
7
-
8
-
9
-
10
-
11
-
12
-
13
-
14
-
15
-
16
-
17
-
18
-
19
-
20
-
21
-
22
-
23
-
24
-
25
-
26
-
27
-
28
-
29
-
30
-
31
-
32
-
33
-
34
-
35
-
36
-
37
-
38
-
39
-
40
-
41
-
42
-
43
-
44
-
45
-
46
-
47
-
48
-
49
-
50
-
51
-
52
-
53
-
54
-
55
-
56
-
57
-
58
-
59
-
60
-
61
-
62
-
63
-
64
-
65
-
66
-
67
-
68
-
69
-
70
-
71
-
72
-
73
-
74
-
75
-
76
-
77
-
78
-
79
-
80
-
81
-
82
-
83
-
84
-
85
-
86
-
87
-
88
-
89
-
90
-
91
-
92
-
93
-
94
-
95
-
96
-
97
-
98
-
99
-
100
-
101
-
102
-
103
-
104
-
105
-
106
-
107
-
108
-
109
-
110
-
111
-
112
-
113
-
114
-
115
-
116
-
117
-
118
-
119
-
120
-
121
-
122
-
123
-
124
-
125
-
126
-
127
-
128
-
129
-
130
-
131
-
132
-
133
-
134
-
135
-
136
-
137
-
138
-
139
-
140
-
141
-
142
-
143
-
144
-
145
-
146
-
147
-
148
-
149
-
 150
150 -
 151
151 -
 152
152 -
 153
153 -
 154
154 -
 155
155 -
 156
156 -
 157
157 -
 158
158 -
 159
159 -
 160
160 -
 161
161 -
 162
162 -
 163
163 -
 164
164 -
 165
165 -
 166
166 -
 167
167 -
 168
168 -
 169
169 -
 170
170 -
171
-
172
-
173
-
174
-
175
-
176
-
177
-
178
-
179
-
180
-
181
-
182
-
183
-
184
-
185
-
186
-
187
-
188
-
189
-
190
-
191
-
192
-
193
-
194
-
195
-
196
-
197
-
198
-
199
-
200
-
201
-
202
-
203
-
204
-
205
-
206
-
207
-
208
-
209
-
210
-
211
-
212
-
213
-
214
-
215
-
216
-
217
-
218
-
219
-
220
-
221
-
222
-
223
-
224
-
225
-
226
-
227
-
228
-
229
-
230
-
231
-
232
-
233
-
234
-
235
-
236
-
237
-
238
-
239
-
240
 |
 |

THE ST. PAUL TRAVELERS COMPANIES, INC. AND SUBSIDIARIES
NOTES TO CONSOLIDATED FINANCIAL STATEMENTS—(Continued)
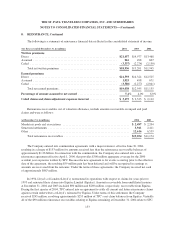
6. INVESTMENTS, Continued
The quarterly valuation procedures described above are in addition to the portfolio managers’ ongoing
responsibility to frequently monitor developments affecting those invested assets, paying particular attention to
events that might give rise to impairment write-downs.
Unrealized Investment Losses
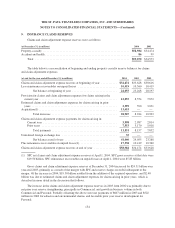
The following table summarizes, for all investment securities in an unrealized loss position at December 31,
2004, the aggregate fair value and gross unrealized loss by length of time those securities have been continuously
in an unrealized loss position.
(at December 31, 2004, in millions)
Less than 12 months
12 months or
longer Total
Fair
Value
Gross
Unrealized
Losses
Fair
Value
Gross
Unrealized
Losses
Fair
Value
Gross
Unrealized
Losses
Fixed maturities
Mortgage-backed securities, collateralized
mortgage obligations and pass through
securities .............................. $ 3,256 $ 33 $ 30 $ 1 $ 3,286 $ 34
U.S. Treasury securities and obligations of U.S.
Government and government agencies and
authorities ............................. 1,743 22 4 — 1,747 22
Obligations of states, municipalities and political
subdivisions ........................... 5,708 49 64 1 5,772 50
Debt securities issued by foreign governments . . 726 4 6 — 732 4
All other corporate bonds ................... 6,190 95 247 4 6,437 99
Redeemable preferred stock ................. 8— 12 1 20 1
Total fixed maturities .................. 17,631 203 363 7 17,994 210
Equity securities
Common stock ........................... 2511— 261
Nonredeemable preferred stock .............. 89 3 17 1 106 4
Total equity securities .................. 114 4 18 1 132 5
Venture capital 53 18 — — 53 18
Total ............................... $17,798 $225 $381 $ 8 $18,179 $233
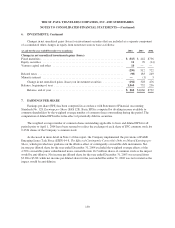
Impairment charges included in net realized investment gains (losses) were as follows:
(for the year ended December 31, in millions) 2004 2003 2002
Fixed maturities ............................................................ $25 $ 65 $255
Equity securities ............................................................ 568
Venture capital ............................................................. 40 ——
Real estate and other ......................................................... 10 19 21
Total ..................................................................... $80 $ 90 $284
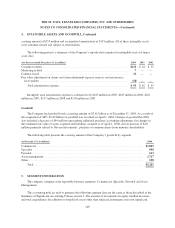
Mortgage Loans
Aggregate annual maturities on mortgage loans are $16 million, $23 million, $32 million, $17 million, and
$103 million for 2005, 2006, 2007, 2008 and 2009 and thereafter, respectively.
148