Travelers 2004 Annual Report Download - page 193
Download and view the complete annual report
Please find page 193 of the 2004 Travelers annual report below. You can navigate through the pages in the report by either clicking on the pages listed below, or by using the keyword search tool below to find specific information within the annual report.-
 1
1 -
2
-
3
-
4
-
5
-
6
-
7
-
8
-
9
-
10
-
11
-
12
-
13
-
14
-
15
-
16
-
17
-
18
-
19
-
20
-
21
-
22
-
23
-
24
-
25
-
26
-
27
-
28
-
29
-
30
-
31
-
32
-
33
-
34
-
35
-
36
-
37
-
38
-
39
-
40
-
41
-
42
-
43
-
44
-
45
-
46
-
47
-
48
-
49
-
50
-
51
-
52
-
53
-
54
-
55
-
56
-
57
-
58
-
59
-
60
-
61
-
62
-
63
-
64
-
65
-
66
-
67
-
68
-
69
-
70
-
71
-
72
-
73
-
74
-
75
-
76
-
77
-
78
-
79
-
80
-
81
-
82
-
83
-
84
-
85
-
86
-
87
-
88
-
89
-
90
-
91
-
92
-
93
-
94
-
95
-
96
-
97
-
98
-
99
-
100
-
101
-
102
-
103
-
104
-
105
-
106
-
107
-
108
-
109
-
110
-
111
-
112
-
113
-
114
-
115
-
116
-
117
-
118
-
119
-
120
-
121
-
122
-
123
-
124
-
125
-
126
-
127
-
128
-
129
-
130
-
131
-
132
-
133
-
134
-
135
-
136
-
137
-
138
-
139
-
140
-
141
-
142
-
143
-
144
-
145
-
146
-
147
-
148
-
149
-
150
-
151
-
152
-
153
-
154
-
155
-
156
-
157
-
158
-
159
-
160
-
161
-
162
-
163
-
164
-
165
-
166
-
167
-
168
-
169
-
170
-
171
-
172
-
173
-
174
-
175
-
176
-
177
-
178
-
179
-
180
-
181
-
182
-
 183
183 -
 184
184 -
 185
185 -
 186
186 -
 187
187 -
 188
188 -
 189
189 -
 190
190 -
 191
191 -
 192
192 -
 193
193 -
 194
194 -
 195
195 -
 196
196 -
 197
197 -
 198
198 -
 199
199 -
 200
200 -
 201
201 -
 202
202 -
 203
203 -
204
-
205
-
206
-
207
-
208
-
209
-
210
-
211
-
212
-
213
-
214
-
215
-
216
-
217
-
218
-
219
-
220
-
221
-
222
-
223
-
224
-
225
-
226
-
227
-
228
-
229
-
230
-
231
-
232
-
233
-
234
-
235
-
236
-
237
-
238
-
239
-
240
 |
 |

THE ST. PAUL TRAVELERS COMPANIES, INC. AND SUBSIDIARIES
NOTES TO CONSOLIDATED FINANCIAL STATEMENTS—(Continued)
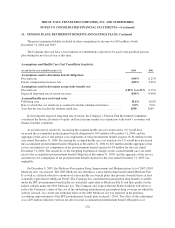
14. PENSION PLANS, RETIREMENT BENEFITS AND SAVINGS PLANS, Continued
To finance the preferred stock purchase for future allocation to qualified employees, the SOP borrowed
$150 million at 9.4% from a primary U.S. underwriting subsidiary. As the principal and interest of the trust’s
loan is paid, a pro rata amount of preferred stock is released for allocation to participating employees. Each share
of preferred stock pays a dividend of $11.72 annually and is currently convertible into eight shares of our
common stock. Preferred stock dividends on all shares held by the trust are used to pay a portion of the SOP
obligation. In addition to dividends paid to the trust, additional cash contributions are made to the SOP as
necessary in order to meet the SOP’s debt obligation.
All common shares and the common stock equivalent of all preferred shares held by the SOP are considered
outstanding for diluted EPS computations and dividends paid on all shares are charged to retained earnings.
The Company follows the provisions of Statement of Position 76-3, “Accounting Practices for Certain
Employee Stock Ownership Plans,” and related interpretations in accounting for this plan. The Company
recorded an expense of $5 million in 2004.
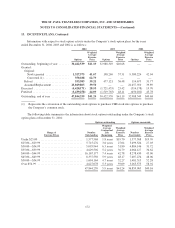
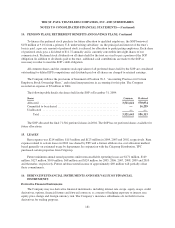
The following table details the shares held in the SOP at December 31, 2004:
Shares Common Preferred
Allocated ...................................................... 3,521,641 570,074
Committed to be released .......................................... — 16,239
Unallocated .................................................... ——
Total ...................................................... 3,521,641 586,313
The SOP allocated the final 71,346 preferred shares in 2004. The SOP has no preferred shares available for
future allocations.
15. LEASES
Rent expense was $214 million, $115 million and $123 million in 2004, 2003 and 2002, respectively. Rent
expense related to certain leases in 2002 was shared by TPC and a former affiliate on a cost allocation method
based generally on estimated usage by department. In conjunction with the Citigroup Distribution, TPC
purchased certain properties from Citigroup.
Future minimum annual rental payments under noncancellable operating leases are $171 million, $149
million, $127 million, $100 million, $68 million and $124 million for 2005, 2006, 2007, 2008, 2009 and 2010
and thereafter, respectively. Future sublease rental income of approximately $69 million will partially offset
these commitments.
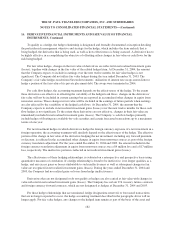
16. DERIVATIVE FINANCIAL INSTRUMENTS AND FAIR VALUE OF FINANCIAL
INSTRUMENTS
Derivative Financial Instruments
The Company may use derivative financial instruments, including interest rate swaps, equity swaps, credit
derivatives, options, financial futures and forward contracts, as a means of hedging exposure to interest rate,
equity price change and foreign currency risk. The Company’s insurance subsidiaries do not hold or issue
derivatives for trading purposes.
181