Travelers 2004 Annual Report Download - page 24
Download and view the complete annual report
Please find page 24 of the 2004 Travelers annual report below. You can navigate through the pages in the report by either clicking on the pages listed below, or by using the keyword search tool below to find specific information within the annual report.-
 1
1 -
2
-
3
-
4
-
5
-
6
-
7
-
8
-
9
-
10
-
11
-
12
-
13
-
 14
14 -
 15
15 -
 16
16 -
 17
17 -
 18
18 -
 19
19 -
 20
20 -
 21
21 -
 22
22 -
 23
23 -
 24
24 -
 25
25 -
 26
26 -
 27
27 -
 28
28 -
 29
29 -
 30
30 -
 31
31 -
 32
32 -
 33
33 -
 34
34 -
35
-
36
-
37
-
38
-
39
-
40
-
41
-
42
-
43
-
44
-
45
-
46
-
47
-
48
-
49
-
50
-
51
-
52
-
53
-
54
-
55
-
56
-
57
-
58
-
59
-
60
-
61
-
62
-
63
-
64
-
65
-
66
-
67
-
68
-
69
-
70
-
71
-
72
-
73
-
74
-
75
-
76
-
77
-
78
-
79
-
80
-
81
-
82
-
83
-
84
-
85
-
86
-
87
-
88
-
89
-
90
-
91
-
92
-
93
-
94
-
95
-
96
-
97
-
98
-
99
-
100
-
101
-
102
-
103
-
104
-
105
-
106
-
107
-
108
-
109
-
110
-
111
-
112
-
113
-
114
-
115
-
116
-
117
-
118
-
119
-
120
-
121
-
122
-
123
-
124
-
125
-
126
-
127
-
128
-
129
-
130
-
131
-
132
-
133
-
134
-
135
-
136
-
137
-
138
-
139
-
140
-
141
-
142
-
143
-
144
-
145
-
146
-
147
-
148
-
149
-
150
-
151
-
152
-
153
-
154
-
155
-
156
-
157
-
158
-
159
-
160
-
161
-
162
-
163
-
164
-
165
-
166
-
167
-
168
-
169
-
170
-
171
-
172
-
173
-
174
-
175
-
176
-
177
-
178
-
179
-
180
-
181
-
182
-
183
-
184
-
185
-
186
-
187
-
188
-
189
-
190
-
191
-
192
-
193
-
194
-
195
-
196
-
197
-
198
-
199
-
200
-
201
-
202
-
203
-
204
-
205
-
206
-
207
-
208
-
209
-
210
-
211
-
212
-
213
-
214
-
215
-
216
-
217
-
218
-
219
-
220
-
221
-
222
-
223
-
224
-
225
-
226
-
227
-
228
-
229
-
230
-
231
-
232
-
233
-
234
-
235
-
236
-
237
-
238
-
239
-
240
 |
 |

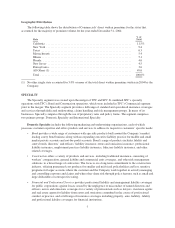
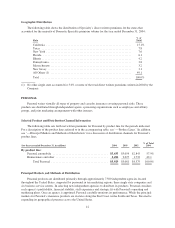
Geographic Distribution
The following table shows the distribution of Specialty’s direct written premiums for the states that
accounted for the majority of Domestic Specialty premium volume for the year ended December 31, 2004:
State
%of
Total
California ........................................................... 15.1%
Texas .............................................................. 7.8
New York ........................................................... 7.6
Florida ............................................................. 6.1
Illinois .............................................................. 4.2
Pennsylvania ......................................................... 3.8
Massachusetts ........................................................ 3.2
New Jersey .......................................................... 3.1
All Others (1) ........................................................ 49.1
Total ............................................................... 100.0%
(1) No other single state accounted for 3.0% or more of the total direct written premiums written in 2004 by the
Company.
PERSONAL
Personal writes virtually all types of property and casualty insurance covering personal risks. These
products are distributed through independent agents, sponsoring organizations such as employee and affinity
groups, and joint marketing arrangements with other insurers.
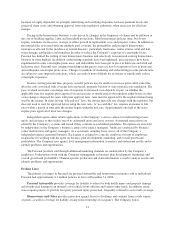
Selected Product and Distribution Channel Information
The following table sets forth net written premiums for Personal by product line for the periods indicated.
For a description of the product lines referred to in the accompanying table, see “—Product Lines.” In addition,
see “—Principal Markets and Methods of Distribution” for a discussion of distribution channels for Personal’s
product lines.
(for the year ended December 31, in millions) 2004 2003 2002
% of Total
2004
By product line:
Personal automobile ...................................... $3,433 $3,054 $2,843 57.9%
Homeowners and other .................................... 2,496 2,027 1,732 42.1
Total Personal ....................................... $5,929 $5,081 $4,575 100.0%
Principal Markets and Methods of Distribution
Personal products are distributed primarily through approximately 7,500 independent agencies located
throughout the United States, supported by personnel in ten marketing regions, three single state companies and
six business service centers. In selecting new independent agencies to distribute its products, Personal considers
each agency’s profitability, financial stability, staff experience and strategic fit with Personal’s operating and
marketing plans. Once an agency is appointed, Personal carefully monitors its performance. While the principal
markets for Personal’s insurance products are in states along the East Coast, in the South and Texas, Personal is
expanding its geographical presence across the United States.
12