Travelers 2004 Annual Report Download - page 80
Download and view the complete annual report
Please find page 80 of the 2004 Travelers annual report below. You can navigate through the pages in the report by either clicking on the pages listed below, or by using the keyword search tool below to find specific information within the annual report.-
 1
1 -
2
-
3
-
4
-
5
-
6
-
7
-
8
-
9
-
10
-
11
-
12
-
13
-
14
-
15
-
16
-
17
-
18
-
19
-
20
-
21
-
22
-
23
-
24
-
25
-
26
-
27
-
28
-
29
-
30
-
31
-
32
-
33
-
34
-
35
-
36
-
37
-
38
-
39
-
40
-
41
-
42
-
43
-
44
-
45
-
46
-
47
-
48
-
49
-
50
-
51
-
52
-
53
-
54
-
55
-
56
-
57
-
58
-
59
-
60
-
61
-
62
-
63
-
64
-
65
-
66
-
67
-
68
-
69
-
 70
70 -
 71
71 -
 72
72 -
 73
73 -
 74
74 -
 75
75 -
 76
76 -
 77
77 -
 78
78 -
 79
79 -
 80
80 -
 81
81 -
 82
82 -
 83
83 -
 84
84 -
 85
85 -
 86
86 -
 87
87 -
 88
88 -
 89
89 -
 90
90 -
91
-
92
-
93
-
94
-
95
-
96
-
97
-
98
-
99
-
100
-
101
-
102
-
103
-
104
-
105
-
106
-
107
-
108
-
109
-
110
-
111
-
112
-
113
-
114
-
115
-
116
-
117
-
118
-
119
-
120
-
121
-
122
-
123
-
124
-
125
-
126
-
127
-
128
-
129
-
130
-
131
-
132
-
133
-
134
-
135
-
136
-
137
-
138
-
139
-
140
-
141
-
142
-
143
-
144
-
145
-
146
-
147
-
148
-
149
-
150
-
151
-
152
-
153
-
154
-
155
-
156
-
157
-
158
-
159
-
160
-
161
-
162
-
163
-
164
-
165
-
166
-
167
-
168
-
169
-
170
-
171
-
172
-
173
-
174
-
175
-
176
-
177
-
178
-
179
-
180
-
181
-
182
-
183
-
184
-
185
-
186
-
187
-
188
-
189
-
190
-
191
-
192
-
193
-
194
-
195
-
196
-
197
-
198
-
199
-
200
-
201
-
202
-
203
-
204
-
205
-
206
-
207
-
208
-
209
-
210
-
211
-
212
-
213
-
214
-
215
-
216
-
217
-
218
-
219
-
220
-
221
-
222
-
223
-
224
-
225
-
226
-
227
-
228
-
229
-
230
-
231
-
232
-
233
-
234
-
235
-
236
-
237
-
238
-
239
-
240
 |
 |

levels also declined substantially. In Bond, the repositioning of the book of business was primarily centered in
the SPC business acquired in the merger.
Net written premiums in 2004 in the majority of the Company’s remaining domestic specialty businesses
were strong, with retention levels at or above historical levels. The Company continued to focus on retaining the
profitable and well-priced book of business that has been built in recent years. Renewal price change increases in
these operations moderated throughout the year to the upper single-digit level. New business levels in 2004 were
down compared with 2003, when renewal rights transactions contributed to strong growth in new business. The
impact of the decline in new business levels in 2004 was partially offset by premium growth resulting from the
transfer of certain business from the Company’s Gulf operation, which was placed in runoff in the second quarter
of the year. In addition, premium volume in these domestic businesses benefited in 2004 from a small amount of
additional transfers of certain business previously written in the Commercial segment’s commercial accounts
operation.
In International Specialty, acquired in the merger, business retention levels (excluding Lloyd’s) were strong
relative to pre-merger levels. New business levels were consistent with 2003, while the rate of renewal price
change increases moderated to the low—single digit levels. The Company continued to focus on retaining its
profitable book of existing international specialty business. At Lloyd’s, premium volume was negatively
impacted by the planned non-renewal of certain personal lines insurance coverages.
The $218 million, or 21%, increase in net written premiums in 2003 over 2002 reflected a favorable
premium rate environment and strong new business, particularly in Bond’s executive liability lines.
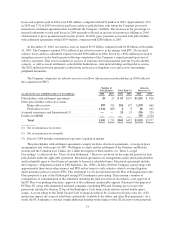
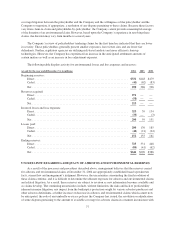
Personal
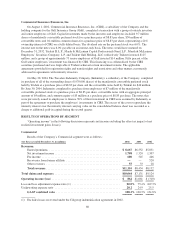
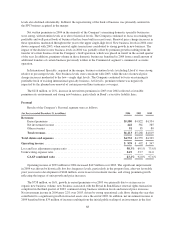
Results of the Company’s Personal segment were as follows:
(for the year ended December 31, in millions) 2004 2003 2002
Revenues:
Earned premiums .................................................. $5,580 $4,822 $4,354
Net investment income .............................................. 442 361 385
Other revenues .................................................... 91 85 80
Total revenues .................................................... $6,113 $5,268 $4,819
Total claims and expenses .............................................. $4,732 $4,555 $4,329
Operating income ..................................................... $ 939 $ 492 $ 347
Loss and loss adjustment expense ratio ..................................... 58.3% 69.1% 73.6%
Underwriting expense ratio .............................................. 24.9 23.7 24.0
GAAP combined ratio ............................................. 83.2% 92.8% 97.6%
Operating income of $939 million in 2004 increased $447 million over 2003. The significant improvement
in 2004 was driven by historically low loss frequency levels, particularly in the property line, after-tax favorable
prior year reserve development of $246 million, an increase in investment income, and strong premium growth
reflecting the impact of unit growth and price increases.
The $758 million, or 16%, growth in earned premiums over 2003 was primarily due to an increase in
organic new business volume, new business associated with the Royal & SunAlliance renewal rights transaction
completed in the third quarter of 2003, continued strong business retention levels and renewal price increases.
Net investment income in 2004 grew 22% over 2003, driven by strong operational cash flows during the year that
contributed to a significant growth in invested assets since the end of 2003. In addition, net investment income in
2004 benefited from $39 million of income resulting from the initial public trading of an investment in the first
68