Reebok 2014 Annual Report Download - page 94
Download and view the complete annual report
Please find page 94 of the 2014 Reebok annual report below. You can navigate through the pages in the report by either clicking on the pages listed below, or by using the keyword search tool below to find specific information within the annual report.-
 1
1 -
2
-
3
-
4
-
5
-
6
-
7
-
8
-
9
-
10
-
11
-
12
-
13
-
14
-
15
-
16
-
17
-
18
-
19
-
20
-
21
-
22
-
23
-
24
-
25
-
26
-
27
-
28
-
29
-
30
-
31
-
32
-
33
-
34
-
35
-
36
-
37
-
38
-
39
-
40
-
41
-
42
-
43
-
44
-
45
-
46
-
47
-
48
-
49
-
50
-
51
-
52
-
53
-
54
-
55
-
56
-
57
-
58
-
59
-
60
-
61
-
62
-
63
-
64
-
65
-
66
-
67
-
68
-
69
-
70
-
71
-
72
-
73
-
74
-
75
-
76
-
77
-
78
-
79
-
80
-
81
-
82
-
83
-
 84
84 -
 85
85 -
 86
86 -
 87
87 -
 88
88 -
 89
89 -
 90
90 -
 91
91 -
 92
92 -
 93
93 -
 94
94 -
 95
95 -
 96
96 -
 97
97 -
 98
98 -
 99
99 -
 100
100 -
 101
101 -
 102
102 -
 103
103 -
 104
104 -
105
-
106
-
107
-
108
-
109
-
110
-
111
-
112
-
113
-
114
-
115
-
116
-
117
-
118
-
119
-
120
-
121
-
122
-
123
-
124
-
125
-
126
-
127
-
128
-
129
-
130
-
131
-
132
-
133
-
134
-
135
-
136
-
137
-
138
-
139
-
140
-
141
-
142
-
143
-
144
-
145
-
146
-
147
-
148
-
149
-
150
-
151
-
152
-
153
-
154
-
155
-
156
-
157
-
158
-
159
-
160
-
161
-
162
-
163
-
164
-
165
-
166
-
167
-
168
-
169
-
170
-
171
-
172
-
173
-
174
-
175
-
176
-
177
-
178
-
179
-
180
-
181
-
182
-
183
-
184
-
185
-
186
-
187
-
188
-
189
-
190
-
191
-
192
-
193
-
194
-
195
-
196
-
197
-
198
-
199
-
200
-
201
-
202
-
203
-
204
-
205
-
206
-
207
-
208
-
209
-
210
-
211
-
212
-
213
-
214
-
215
-
216
-
217
-
218
-
219
-
220
-
221
-
222
-
223
-
224
-
225
-
226
-
227
-
228
-
229
-
230
-
231
-
232
-
233
-
234
-
235
-
236
-
237
-
238
-
239
-
240
-
241
-
242
-
243
-
244
-
245
-
246
-
247
-
248
-
249
-
250
-
251
-
252
-
253
-
254
-
255
-
256
-
257
-
258
-
259
-
260
-
261
-
262
-
263
-
264
-
265
-
266
-
267
-
268
 |
 |
adidas Group
/
2014 Annual Report
Group Management Report – Our Group
90
2014
Sustainability
/
02.8
/
To illustrate how suppliers should implement our Standards, we have created a set of detailed
guidelines for use in factory settings, which demonstrate our expectations for fair, healthy, safe
workplace conditions and environmentally sound factory operations. The guidelines are updated on
a regular basis and are publicly available on our website. They are also used to determine suppliers’
compliance with our Standards and to advise and train our suppliers in improving their social and
environmental performance.
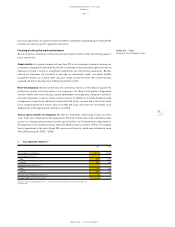
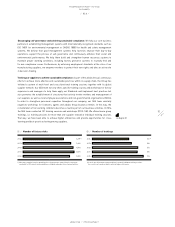
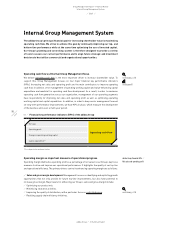
Monitoring and rating our factories: The SEA team assesses compliance with the Workplace
Standards by means of factory inspections. Our auditors check performance against a customised
risk list for each factory that is monitored. The methodology is linked to a factory rating which
measures the effectiveness of compliance systems and the work of their administrators. A KPI
rating tool helps us evaluate six fundamental elements of social compliance covering management
commitment, the quality of management systems in place, worker-management communication,
training delivered, transparent reporting and measurement of compliance activities. According to
the results, suppliers are assessed with a compliance rating (C rating) score between 1 and 5 (with
5 being the best rating). The latest results show that, in 2014,
64
% of our direct suppliers achieved
a 3C (good) or better rating (2013: 54%). We have thus already achieved our target for 2015 to have
60% of our direct suppliers meet a 3C (good) rating or better under our social compliance KPI rating.
With this approach, we encourage our suppliers to take responsibility for their own performance
including reporting of key social and health and safety indicators. These ratings are a non-financial
KPI for our Group. They also enable us to precisely determine training needs at our suppliers’
factories.
During 2014, we conducted 1,299 factory visits (2013: 1,489 visits) involving different types of audits,
trainings and meetings with factory management as well as employees at various levels in our
supply chain. We have seen more supplier factories qualifying for self-governance status (factories
that have reached 4C or 5C status) which means that factories have proven to operate effective
human resources, health and safety as well as environmental management systems by themselves.
Because of their high compliance performance, factory audits were slightly reduced at these factory
facilities. In addition to our own monitoring activities, we value independent and unannounced
assessment by third parties to demonstrate the credibility of and provide verified information about
our programme to stakeholders. As a member of the Fair Labor Association (FLA), the adidas Group
is subject to external assessment by independent monitors, participation in the FLA third-party
complaint system and public reporting. The monitoring programme of the adidas Group has been
accredited by the FLA twice since joining the organisation 15 years ago. During this period, more
than 300 independent assessments have been conducted at adidas Group suppliers.
www.adidas-group.com/s/standards-and-policies
see Table 01
see Internal Group Management System, p. 98
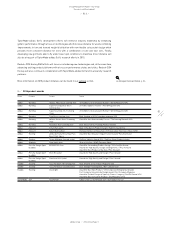
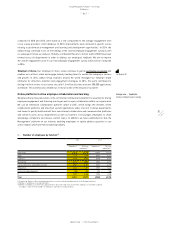
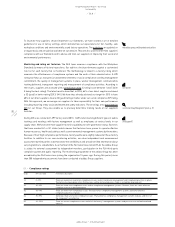
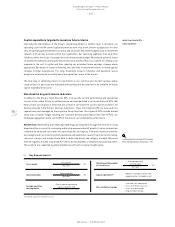
01
/
Compliance ratings
Grade KPI score band Performance description
1C 0–29% There are numerous severe non-compliance issues and no compliance management and compliance practices in place.
The factory has been given notice that business will be terminated unless there is immediate improvement.
2C 30–59% There are some non-compliance issues and no compliance management systems. However, there are some effective
compliance practices being delivered.
3C 60–79% There are minor non-compliance issues. The factory has compliance management systems and some effective
compliance practices in place.
4C 80–89% Generally, there are no non-compliance issues. The factory has compliance management systems in place, and most of
the components are effective.
5C 90–100% There are no non-compliance issues and all of the factory's management systems and practices are well delivered and
effective.
see Diagram 02