Reebok 2014 Annual Report Download - page 114
Download and view the complete annual report
Please find page 114 of the 2014 Reebok annual report below. You can navigate through the pages in the report by either clicking on the pages listed below, or by using the keyword search tool below to find specific information within the annual report.-
 1
1 -
2
-
3
-
4
-
5
-
6
-
7
-
8
-
9
-
10
-
11
-
12
-
13
-
14
-
15
-
16
-
17
-
18
-
19
-
20
-
21
-
22
-
23
-
24
-
25
-
26
-
27
-
28
-
29
-
30
-
31
-
32
-
33
-
34
-
35
-
36
-
37
-
38
-
39
-
40
-
41
-
42
-
43
-
44
-
45
-
46
-
47
-
48
-
49
-
50
-
51
-
52
-
53
-
54
-
55
-
56
-
57
-
58
-
59
-
60
-
61
-
62
-
63
-
64
-
65
-
66
-
67
-
68
-
69
-
70
-
71
-
72
-
73
-
74
-
75
-
76
-
77
-
78
-
79
-
80
-
81
-
82
-
83
-
84
-
85
-
86
-
87
-
88
-
89
-
90
-
91
-
92
-
93
-
94
-
95
-
96
-
97
-
98
-
99
-
100
-
101
-
102
-
103
-
 104
104 -
 105
105 -
 106
106 -
 107
107 -
 108
108 -
 109
109 -
 110
110 -
 111
111 -
 112
112 -
 113
113 -
 114
114 -
 115
115 -
 116
116 -
 117
117 -
 118
118 -
 119
119 -
 120
120 -
 121
121 -
 122
122 -
 123
123 -
 124
124 -
125
-
126
-
127
-
128
-
129
-
130
-
131
-
132
-
133
-
134
-
135
-
136
-
137
-
138
-
139
-
140
-
141
-
142
-
143
-
144
-
145
-
146
-
147
-
148
-
149
-
150
-
151
-
152
-
153
-
154
-
155
-
156
-
157
-
158
-
159
-
160
-
161
-
162
-
163
-
164
-
165
-
166
-
167
-
168
-
169
-
170
-
171
-
172
-
173
-
174
-
175
-
176
-
177
-
178
-
179
-
180
-
181
-
182
-
183
-
184
-
185
-
186
-
187
-
188
-
189
-
190
-
191
-
192
-
193
-
194
-
195
-
196
-
197
-
198
-
199
-
200
-
201
-
202
-
203
-
204
-
205
-
206
-
207
-
208
-
209
-
210
-
211
-
212
-
213
-
214
-
215
-
216
-
217
-
218
-
219
-
220
-
221
-
222
-
223
-
224
-
225
-
226
-
227
-
228
-
229
-
230
-
231
-
232
-
233
-
234
-
235
-
236
-
237
-
238
-
239
-
240
-
241
-
242
-
243
-
244
-
245
-
246
-
247
-
248
-
249
-
250
-
251
-
252
-
253
-
254
-
255
-
256
-
257
-
258
-
259
-
260
-
261
-
262
-
263
-
264
-
265
-
266
-
267
-
268
 |
 |
110
2014
/
03.2
/
adidas Group
/
2014 Annual Report
Group Management Report – Financial Review
Group Business Performance
/
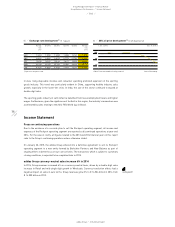
Income Statement
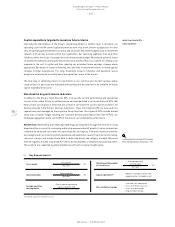
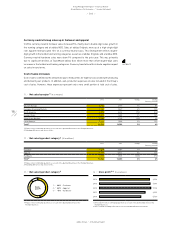
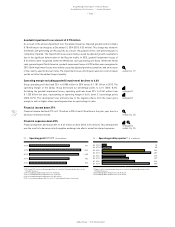
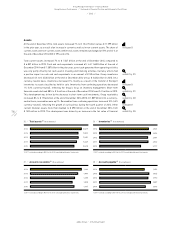
Other operating expenses as a percentage of sales up 0.3 percentage points
Other operating expenses, including depreciation and amortisation, consist of items such as sales
working budget, marketing working budget and operating overhead costs. In 2014, other operating
expenses increased 3% to € 6.203 billion (2013: € 6.013 billion), as a result of higher expenditure
related to the expansion of the Group’s own-retail activities as well as an increase in sales and
marketing working budget expenditure. As a percentage of sales, other operating expenses
increased 0.3 percentage points to 42.7% from 42.3% in 2013.
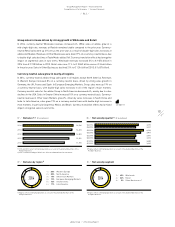
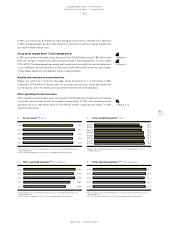
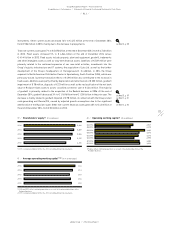
Sales working budget as a percentage of sales increases 0.2 percentage points
Sales working budget consists of expenses to support the Group’s sell-through development.
Expenditures relate to advertising and promotion initiatives at the point of sale as well as store
furniture and fixtures. As sales working budget expenses are channel specific, they are allocated
to the Group’s operating segments. In absolute terms, sales working budget expenditure increased
12% to € 375 million in 2014 from € 336 million in the prior year. This development was mainly a
result of higher expenditure related to the expansion of the Group’s own-retail activities. By brand,
adidas sales working budget increased 13% to € 287 million compared to € 253 million in the prior
year. Sales working budget for Reebok grew 12% to € 60 million at year-end (2013: € 53 million).
The Group’s sales working budget as a percentage of sales increased 0.2 percentage points to 2.6%
(2013: 2.4%).
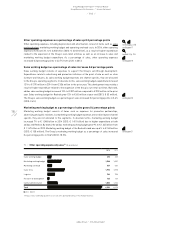
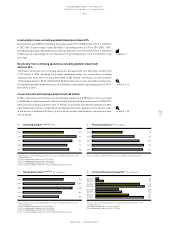
Marketing working budget as a percentage of sales grows 0.4 percentage points
Marketing working budget consists of items such as expenses for promotion partnerships,
advertising and public relations. As marketing working budget expenses are not distribution channel
specific, they are not allocated to the segments. In absolute terms, marketing working budget
increased 7% to € 1.548 billion in 2014 (2013: € 1.451 billion) due to higher expenditure at both
adidas and Reebok. By brand, the adidas marketing working budget grew 9% to € 1.245 billion from
€ 1.147 billion in 2013. Marketing working budget of the Reebok brand was up 6% to € 160 million
(2013: € 150 million). The Group’s marketing working budget as a percentage of sales increased
0.4 percentage points to 10.6% (2013: 10.2%).
see Glossary, p. 258
see Diagram 17
see Note 31, p. 234
see Diagram 18
see Diagram 20
see Diagram 21
19
/
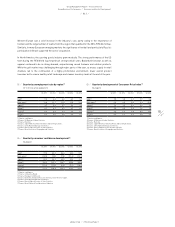
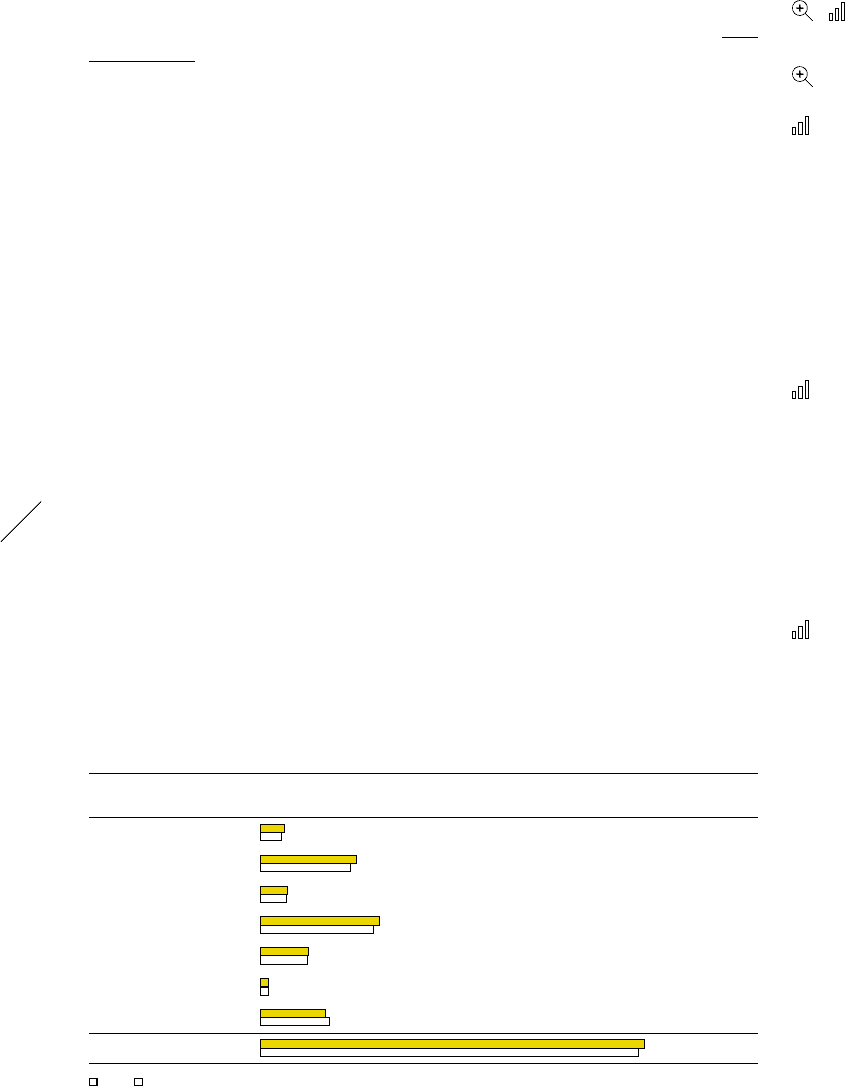
Other operating expenses by area 1) (€ in millions)
2014 2013
Sales working budget 375 336
Marketing working budget 1,548 1,451
Marketing overhead 427 420
Sales force 1,915 1,815
Logistics 763 753
Research & development 126 124
Central administration 1,050 1,114
Total 6,203 6,013
■ 2014 ■ 2013
1) Figures reflect continuing operations as a result of the planned divestiture of the Rockport business.