Reebok 2014 Annual Report Download - page 74
Download and view the complete annual report
Please find page 74 of the 2014 Reebok annual report below. You can navigate through the pages in the report by either clicking on the pages listed below, or by using the keyword search tool below to find specific information within the annual report.-
 1
1 -
2
-
3
-
4
-
5
-
6
-
7
-
8
-
9
-
10
-
11
-
12
-
13
-
14
-
15
-
16
-
17
-
18
-
19
-
20
-
21
-
22
-
23
-
24
-
25
-
26
-
27
-
28
-
29
-
30
-
31
-
32
-
33
-
34
-
35
-
36
-
37
-
38
-
39
-
40
-
41
-
42
-
43
-
44
-
45
-
46
-
47
-
48
-
49
-
50
-
51
-
52
-
53
-
54
-
55
-
56
-
57
-
58
-
59
-
60
-
61
-
62
-
63
-
 64
64 -
 65
65 -
 66
66 -
 67
67 -
 68
68 -
 69
69 -
 70
70 -
 71
71 -
 72
72 -
 73
73 -
 74
74 -
 75
75 -
 76
76 -
 77
77 -
 78
78 -
 79
79 -
 80
80 -
 81
81 -
 82
82 -
 83
83 -
 84
84 -
85
-
86
-
87
-
88
-
89
-
90
-
91
-
92
-
93
-
94
-
95
-
96
-
97
-
98
-
99
-
100
-
101
-
102
-
103
-
104
-
105
-
106
-
107
-
108
-
109
-
110
-
111
-
112
-
113
-
114
-
115
-
116
-
117
-
118
-
119
-
120
-
121
-
122
-
123
-
124
-
125
-
126
-
127
-
128
-
129
-
130
-
131
-
132
-
133
-
134
-
135
-
136
-
137
-
138
-
139
-
140
-
141
-
142
-
143
-
144
-
145
-
146
-
147
-
148
-
149
-
150
-
151
-
152
-
153
-
154
-
155
-
156
-
157
-
158
-
159
-
160
-
161
-
162
-
163
-
164
-
165
-
166
-
167
-
168
-
169
-
170
-
171
-
172
-
173
-
174
-
175
-
176
-
177
-
178
-
179
-
180
-
181
-
182
-
183
-
184
-
185
-
186
-
187
-
188
-
189
-
190
-
191
-
192
-
193
-
194
-
195
-
196
-
197
-
198
-
199
-
200
-
201
-
202
-
203
-
204
-
205
-
206
-
207
-
208
-
209
-
210
-
211
-
212
-
213
-
214
-
215
-
216
-
217
-
218
-
219
-
220
-
221
-
222
-
223
-
224
-
225
-
226
-
227
-
228
-
229
-
230
-
231
-
232
-
233
-
234
-
235
-
236
-
237
-
238
-
239
-
240
-
241
-
242
-
243
-
244
-
245
-
246
-
247
-
248
-
249
-
250
-
251
-
252
-
253
-
254
-
255
-
256
-
257
-
258
-
259
-
260
-
261
-
262
-
263
-
264
-
265
-
266
-
267
-
268
 |
 |
adidas Group
/
2014 Annual Report
Group Management Report – Our Group
70
2014
Global Operations
/
02.5
/
Majority of production through independent suppliers
To minimise production costs, we outsource almost 100% of production to independent third-
party suppliers, primarily located in Asia. While we provide them with detailed specifications for
production and delivery, these suppliers possess excellent expertise in cost-efficient, high-volume
production of footwear, apparel and hardware. The latest list of our suppliers can be found on our
website.
The adidas Group also operates a limited number of own production and assembly sites in the USA
(4), Canada (3) and Germany (1). In order to ensure the high quality that consumers expect from
our products, we enforce strict control and inspection procedures at our suppliers and in our own
factories. In addition, we promote adherence to social and environmental standards throughout our
supply chain.
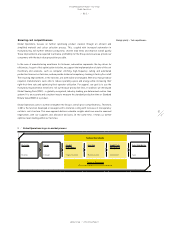
Global Operations manages product development, sourcing and distribution for adidas and Reebok
as well as for adidas Golf and Ashworth. Due to the specific sourcing requirements in their respective
fields of business, TaylorMade, Reebok-CCM Hockey, Adams Golf and the Sports Licensed Division
are not serviced through Global Operations, but instead utilise their own purchasing organisations.
In order to quickly seize short-term opportunities in their local market or react to trade regulations,
Group subsidiaries may also source from selected local suppliers outside the realm of Global
Operations. Local purchases, however, account only for a minor portion of the Group’s total sourcing
volume.
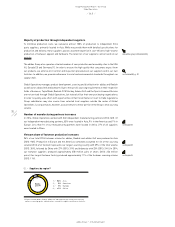
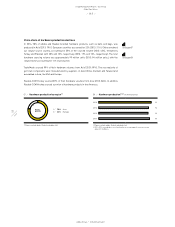
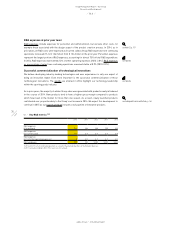
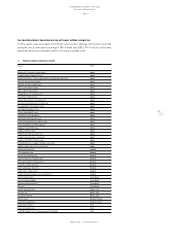
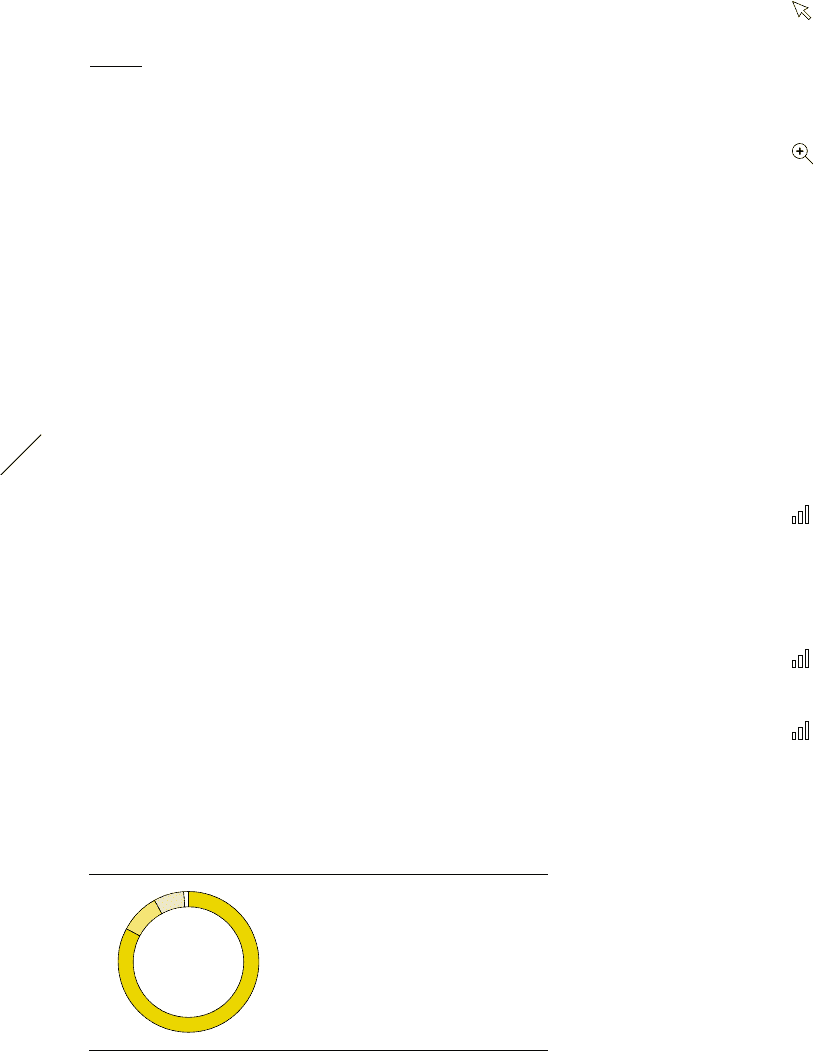
Number of manufacturing partners increases
In 2014, Global Operations worked with 340 independent manufacturing partners (2013: 322). Of
our independent manufacturing partners, 83% were located in Asia, 9% in the Americas and 7% in
Europe. Less than 1% of our manufacturing partners were located in Africa. 27% of all suppliers
were located in China.
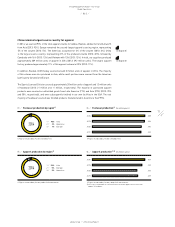
Vietnam share of footwear production increases
96% of our total 2014 footwear volume for adidas, Reebok and adidas Golf was produced in Asia
(2013: 96%). Production in Europe and the Americas combined accounted for 4% of the sourcing
volume (2013: 4%). Vietnam represents our largest sourcing country with 39% of the total volume
(2013: 35%), followed by China with 27% (2013: 31%) and Indonesia with 23% (2013: 24%). In 2014,
our footwear suppliers produced approximately 258 million pairs of shoes (2013: 256 million
pairs). Our largest footwear factory produced approximately 11% of the footwear sourcing volume
(2013: 11%).
www.adidas-group.com/sustainability
see Sustainability, p. 89
see Diagram 02
see Diagram 03
see Diagram 04
02
/
Suppliers by region 1)
1) Figures include adidas, Reebok, adidas Golf and Ashworth, but exclude local sourcing
partners, sourcing agents, subcontractors, second-tier suppliers and licensee factories.
1
/
83% Asia
2
/
9% Americas
3
/
7% Europe
4
/
< 1% Africa
2014
1
2 3 4