Reebok 2014 Annual Report Download - page 140
Download and view the complete annual report
Please find page 140 of the 2014 Reebok annual report below. You can navigate through the pages in the report by either clicking on the pages listed below, or by using the keyword search tool below to find specific information within the annual report.-
 1
1 -
2
-
3
-
4
-
5
-
6
-
7
-
8
-
9
-
10
-
11
-
12
-
13
-
14
-
15
-
16
-
17
-
18
-
19
-
20
-
21
-
22
-
23
-
24
-
25
-
26
-
27
-
28
-
29
-
30
-
31
-
32
-
33
-
34
-
35
-
36
-
37
-
38
-
39
-
40
-
41
-
42
-
43
-
44
-
45
-
46
-
47
-
48
-
49
-
50
-
51
-
52
-
53
-
54
-
55
-
56
-
57
-
58
-
59
-
60
-
61
-
62
-
63
-
64
-
65
-
66
-
67
-
68
-
69
-
70
-
71
-
72
-
73
-
74
-
75
-
76
-
77
-
78
-
79
-
80
-
81
-
82
-
83
-
84
-
85
-
86
-
87
-
88
-
89
-
90
-
91
-
92
-
93
-
94
-
95
-
96
-
97
-
98
-
99
-
100
-
101
-
102
-
103
-
104
-
105
-
106
-
107
-
108
-
109
-
110
-
111
-
112
-
113
-
114
-
115
-
116
-
117
-
118
-
119
-
120
-
121
-
122
-
123
-
124
-
125
-
126
-
127
-
128
-
129
-
 130
130 -
 131
131 -
 132
132 -
 133
133 -
 134
134 -
 135
135 -
 136
136 -
 137
137 -
 138
138 -
 139
139 -
 140
140 -
 141
141 -
 142
142 -
 143
143 -
 144
144 -
 145
145 -
 146
146 -
 147
147 -
 148
148 -
 149
149 -
 150
150 -
151
-
152
-
153
-
154
-
155
-
156
-
157
-
158
-
159
-
160
-
161
-
162
-
163
-
164
-
165
-
166
-
167
-
168
-
169
-
170
-
171
-
172
-
173
-
174
-
175
-
176
-
177
-
178
-
179
-
180
-
181
-
182
-
183
-
184
-
185
-
186
-
187
-
188
-
189
-
190
-
191
-
192
-
193
-
194
-
195
-
196
-
197
-
198
-
199
-
200
-
201
-
202
-
203
-
204
-
205
-
206
-
207
-
208
-
209
-
210
-
211
-
212
-
213
-
214
-
215
-
216
-
217
-
218
-
219
-
220
-
221
-
222
-
223
-
224
-
225
-
226
-
227
-
228
-
229
-
230
-
231
-
232
-
233
-
234
-
235
-
236
-
237
-
238
-
239
-
240
-
241
-
242
-
243
-
244
-
245
-
246
-
247
-
248
-
249
-
250
-
251
-
252
-
253
-
254
-
255
-
256
-
257
-
258
-
259
-
260
-
261
-
262
-
263
-
264
-
265
-
266
-
267
-
268
 |
 |
3
136
2014
/
03.3
/
adidas Group
/
2014 Annual Report
Group Management Report – Financial Review
Business Performance by Segment
/
Wholesale Business Performance
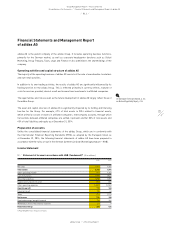
Business Performance by Segment
The adidas Group has divided its operating activities into Wholesale, Retail and Other
Businesses. The Wholesale segment comprises the adidas and Reebok business activities
with retailers. The Retail segment comprises the own-retail and e-commerce activities
of the adidas and Reebok brands. The financial results of TaylorMade-adidas Golf,
Reebok-CCM Hockey and Other Centrally Managed Brands, which comprise brands such as
Y-3 and Five Ten, are aggregated under Other Businesses.
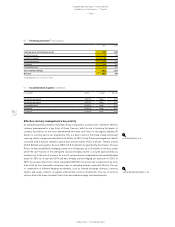
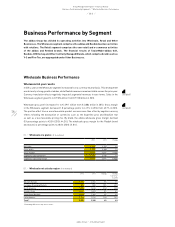
Wholesale Business Performance
Wholesale full year results
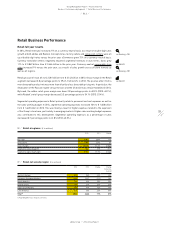
In 2014, sales in the Wholesale segment increased 6% on a currency-neutral basis. This development
was driven by strong growth at adidas, while Reebok revenues remained stable versus the prior year.
Currency translation effects negatively impacted segmental revenues in euro terms. Sales in the
Wholesale segment grew 3% to € 9.376 billion from € 9.100 billion in 2013.
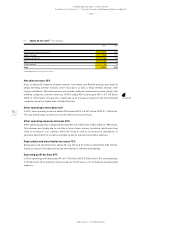
Wholesale gross profit increased 1% to € 3.911 billion from € 3.884 billion in 2013. Gross margin
in the Wholesale segment decreased 1.0 percentage points to 41.7% in 2014 from 42.7% in 2013.
The positive effect from a more favourable product mix was more than offset by negative currency
effects following the devaluation of currencies such as the Argentine peso and Brazilian real
as well as a less favourable pricing mix. By brand, the adidas wholesale gross margin declined
0.9 percentage points to 43.3% (2013: 44.2%). The wholesale gross margin for the Reebok brand
decreased 2.4 percentage points to 28.6% (2013: 31.0%).
see Table 01
see Table 01
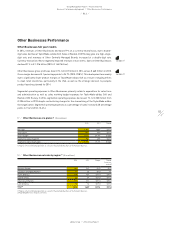
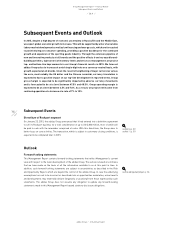
01
/
Wholesale at a glance (€ in millions)
2014 2013 Change
Net sales 9,376 9,100 3%
Gross profit 3,911 3,884 1%
Gross margin 41.7% 42.7% (1.0pp)
Segmental operating profit 3,100 3,082 1%
Segmental operating margin 33.1% 33.9% (0.8pp)
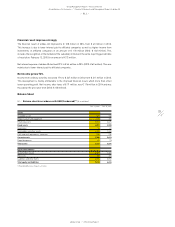
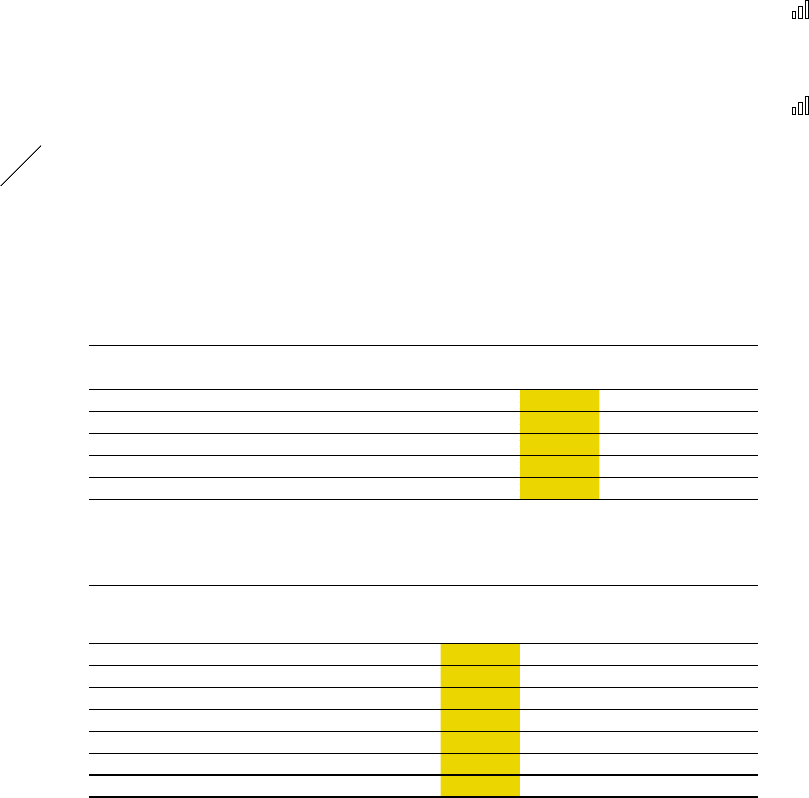
02
/
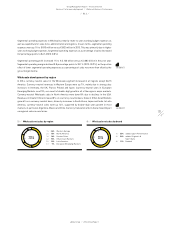
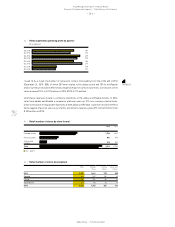
Wholesale net sales by region (€ in millions)
2014 2013 Change Change
(currency-
neutral)
Western Europe 3,156 2,940 7% 7%
European Emerging Markets 625 545 15% 23%
North America 1,485 1,633 (9%) (8%)
Greater China 1,516 1,403 8% 8%
Other Asian Markets 1,401 1,368 2% 6%
Latin America 1,193 1,210 (1%) 14%
Total 1) 9,376 9,100 3% 6%
1) Rounding differences may arise in totals.