Reebok 2014 Annual Report Download - page 214
Download and view the complete annual report
Please find page 214 of the 2014 Reebok annual report below. You can navigate through the pages in the report by either clicking on the pages listed below, or by using the keyword search tool below to find specific information within the annual report.-
 1
1 -
2
-
3
-
4
-
5
-
6
-
7
-
8
-
9
-
10
-
11
-
12
-
13
-
14
-
15
-
16
-
17
-
18
-
19
-
20
-
21
-
22
-
23
-
24
-
25
-
26
-
27
-
28
-
29
-
30
-
31
-
32
-
33
-
34
-
35
-
36
-
37
-
38
-
39
-
40
-
41
-
42
-
43
-
44
-
45
-
46
-
47
-
48
-
49
-
50
-
51
-
52
-
53
-
54
-
55
-
56
-
57
-
58
-
59
-
60
-
61
-
62
-
63
-
64
-
65
-
66
-
67
-
68
-
69
-
70
-
71
-
72
-
73
-
74
-
75
-
76
-
77
-
78
-
79
-
80
-
81
-
82
-
83
-
84
-
85
-
86
-
87
-
88
-
89
-
90
-
91
-
92
-
93
-
94
-
95
-
96
-
97
-
98
-
99
-
100
-
101
-
102
-
103
-
104
-
105
-
106
-
107
-
108
-
109
-
110
-
111
-
112
-
113
-
114
-
115
-
116
-
117
-
118
-
119
-
120
-
121
-
122
-
123
-
124
-
125
-
126
-
127
-
128
-
129
-
130
-
131
-
132
-
133
-
134
-
135
-
136
-
137
-
138
-
139
-
140
-
141
-
142
-
143
-
144
-
145
-
146
-
147
-
148
-
149
-
150
-
151
-
152
-
153
-
154
-
155
-
156
-
157
-
158
-
159
-
160
-
161
-
162
-
163
-
164
-
165
-
166
-
167
-
168
-
169
-
170
-
171
-
172
-
173
-
174
-
175
-
176
-
177
-
178
-
179
-
180
-
181
-
182
-
183
-
184
-
185
-
186
-
187
-
188
-
189
-
190
-
191
-
192
-
193
-
194
-
195
-
196
-
197
-
198
-
199
-
200
-
201
-
202
-
203
-
 204
204 -
 205
205 -
 206
206 -
 207
207 -
 208
208 -
 209
209 -
 210
210 -
 211
211 -
 212
212 -
 213
213 -
 214
214 -
 215
215 -
 216
216 -
 217
217 -
 218
218 -
 219
219 -
 220
220 -
 221
221 -
 222
222 -
 223
223 -
 224
224 -
225
-
226
-
227
-
228
-
229
-
230
-
231
-
232
-
233
-
234
-
235
-
236
-
237
-
238
-
239
-
240
-
241
-
242
-
243
-
244
-
245
-
246
-
247
-
248
-
249
-
250
-
251
-
252
-
253
-
254
-
255
-
256
-
257
-
258
-
259
-
260
-
261
-
262
-
263
-
264
-
265
-
266
-
267
-
268
 |
 |
adidas Group
/
2014 Annual Report
Consolidated Financial Statements
210
2014
/
04.8
/
Notes
/
Notes to the Consolidated Statement of Financial Position
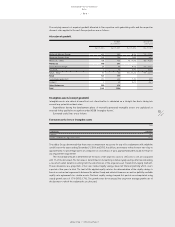
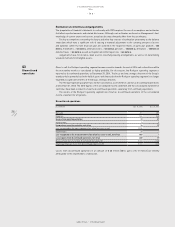
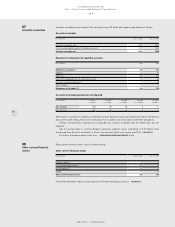
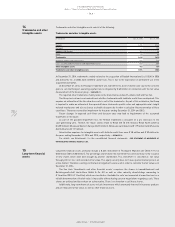
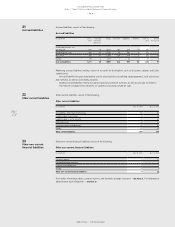
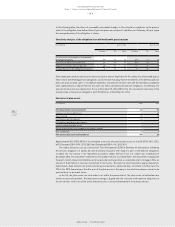
At December 31, 2014, the disposal group Rockport was stated at fair value less costs to sell and comprised the
following major classes of assets and liabilities:
Classes of assets and liabilities
(€ in millions) Dec. 31, 2014
Accounts receivable 49
Other current financial assets 1
Inventories 88
Total current assets 139
Property, plant and equipment 7
Trademarks 112
Other intangible assets 1
Total non-current assets 121
Total assets 260
Accounts payable 37
Other current provisions 1
Current accrued liabilities 6
Other current liabilities 2
Total current liabilities 46
Total liabilities 46
The non-recurring fair value measurement for the disposal group has been categorised as a Level 3 fair value.
The fair value is based on the sale and purchase agreement for the Rockport business which was signed on
January 23, 2015
/
SEE NOTE 42. The agreement foresees a total consideration of up to US $ 280 million, most of
which will be paid in cash with the remainder comprised of fixed and contingent promissory notes.
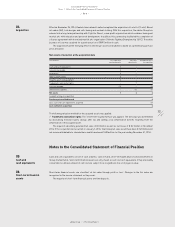
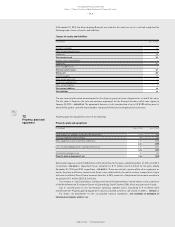
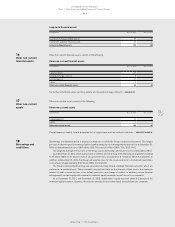
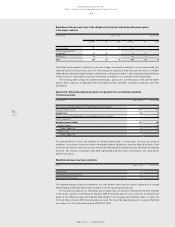
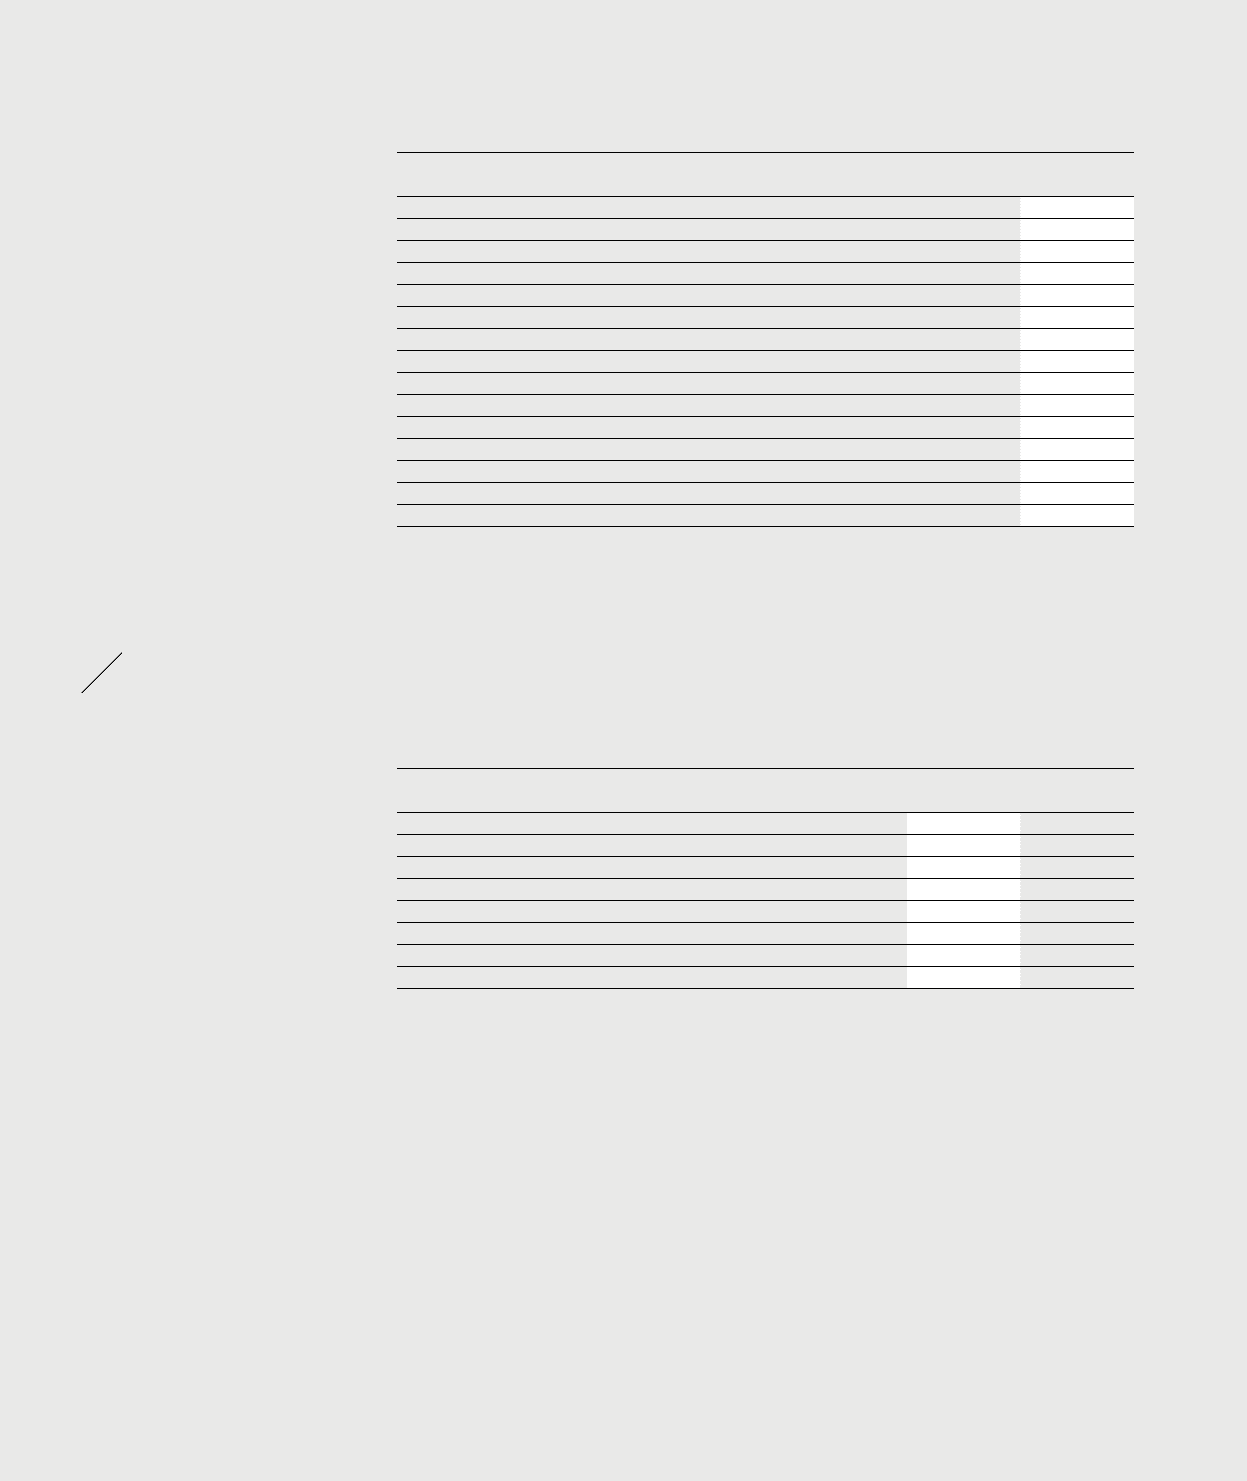
Property, plant and equipment consist of the following:
Property, plant and equipment
(€ in millions) Dec. 31, 2014 Dec. 31, 2013
Land, land leases, buildings and leasehold improvements 1,073 802
Technical equipment and machinery 268 254
Other equipment as well as furniture and fixtures 1,323 1,202
2,664 2,258
Less: accumulated depreciation and impairment losses 1,369 1,181
1,296 1,077
Construction in progress, net 159 161
Property, plant and equipment, net 1,454 1,238
Depreciation expenses were € 258 million and € 234 million for the years ending December 31, 2014 and 2013,
respectively
/
SEE NOTE 31. Impairment losses amounted to € 17 million and € 4 million for the years ending
December 31, 2014 and 2013, respectively
/
SEE NOTE 31. These are related to assets within other equipment as
well as furniture and fixtures, mainly in the Group’s own-retail activities, for which contrary to expectations there
will be an insufficient flow of future economic benefits. In 2014, reversals of impairment losses were recorded in
an amount of € 1 million (2013: € 2 million).
The increase in ‘Land, land leases, buildings and leasehold improvements’ mainly relates to the acquisition
of the North American Distribution Centre in Spartanburg, South Carolina (USA), which was previously leased.
Due to concrete plans to sell the Rockport operating segment, assets amounting to € 12 million were
transferred from ‘Property, plant & equipment‘ to ‘Assets classified as held for sale’ at year-end 2014
/
SEE NOTE 11.
For details see Attachment I to the consolidated financial statements
/
SEE STATEMENT OF MOVEMENTS OF
INTANGIBLE AND TANGIBLE ASSETS, P. 246.
12
Property, plant and
equipment