Reebok 2014 Annual Report Download - page 120
Download and view the complete annual report
Please find page 120 of the 2014 Reebok annual report below. You can navigate through the pages in the report by either clicking on the pages listed below, or by using the keyword search tool below to find specific information within the annual report.-
 1
1 -
2
-
3
-
4
-
5
-
6
-
7
-
8
-
9
-
10
-
11
-
12
-
13
-
14
-
15
-
16
-
17
-
18
-
19
-
20
-
21
-
22
-
23
-
24
-
25
-
26
-
27
-
28
-
29
-
30
-
31
-
32
-
33
-
34
-
35
-
36
-
37
-
38
-
39
-
40
-
41
-
42
-
43
-
44
-
45
-
46
-
47
-
48
-
49
-
50
-
51
-
52
-
53
-
54
-
55
-
56
-
57
-
58
-
59
-
60
-
61
-
62
-
63
-
64
-
65
-
66
-
67
-
68
-
69
-
70
-
71
-
72
-
73
-
74
-
75
-
76
-
77
-
78
-
79
-
80
-
81
-
82
-
83
-
84
-
85
-
86
-
87
-
88
-
89
-
90
-
91
-
92
-
93
-
94
-
95
-
96
-
97
-
98
-
99
-
100
-
101
-
102
-
103
-
104
-
105
-
106
-
107
-
108
-
109
-
 110
110 -
 111
111 -
 112
112 -
 113
113 -
 114
114 -
 115
115 -
 116
116 -
 117
117 -
 118
118 -
 119
119 -
 120
120 -
 121
121 -
 122
122 -
 123
123 -
 124
124 -
 125
125 -
 126
126 -
 127
127 -
 128
128 -
 129
129 -
 130
130 -
131
-
132
-
133
-
134
-
135
-
136
-
137
-
138
-
139
-
140
-
141
-
142
-
143
-
144
-
145
-
146
-
147
-
148
-
149
-
150
-
151
-
152
-
153
-
154
-
155
-
156
-
157
-
158
-
159
-
160
-
161
-
162
-
163
-
164
-
165
-
166
-
167
-
168
-
169
-
170
-
171
-
172
-
173
-
174
-
175
-
176
-
177
-
178
-
179
-
180
-
181
-
182
-
183
-
184
-
185
-
186
-
187
-
188
-
189
-
190
-
191
-
192
-
193
-
194
-
195
-
196
-
197
-
198
-
199
-
200
-
201
-
202
-
203
-
204
-
205
-
206
-
207
-
208
-
209
-
210
-
211
-
212
-
213
-
214
-
215
-
216
-
217
-
218
-
219
-
220
-
221
-
222
-
223
-
224
-
225
-
226
-
227
-
228
-
229
-
230
-
231
-
232
-
233
-
234
-
235
-
236
-
237
-
238
-
239
-
240
-
241
-
242
-
243
-
244
-
245
-
246
-
247
-
248
-
249
-
250
-
251
-
252
-
253
-
254
-
255
-
256
-
257
-
258
-
259
-
260
-
261
-
262
-
263
-
264
-
265
-
266
-
267
-
268
 |
 |
116
2014
/
03.2
/
adidas Group
/
2014 Annual Report
Group Management Report – Financial Review
Group Business Performance
/
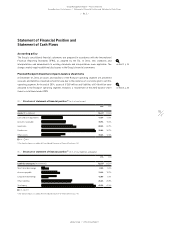
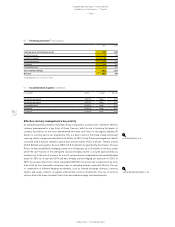
Statement of Financial Position and Statement of Cash Flows
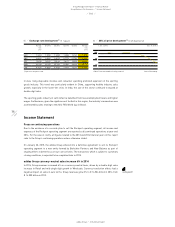
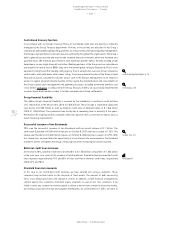
Assets
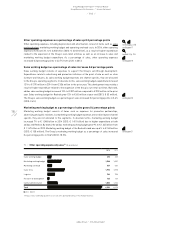
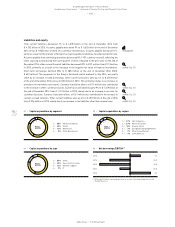
At the end of December 2014, total assets increased 7% to € 12.417 billion versus € 11.599 billion
in the prior year, as a result of an increase in current as well as in non-current assets. The share of
current assets and non-current assets within total assets remained unchanged at 59% and 41% at
the end of December 2014 (2013: 59% and 41%).
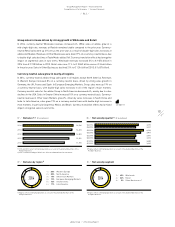
Total current assets increased 7% to € 7.347 billion at the end of December 2014 compared to
€ 6.857 billion in 2013. Cash and cash equivalents increased 6% to € 1.683 billion at the end of
December 2014 from € 1.587 billion in the prior year, as net cash generated from operating activities
was only partly offset by net cash used in investing and financing activities. Currency effects had
a positive impact on cash and cash equivalents in an amount of € 50 million. Group inventories
decreased 4% to € 2.526 billion at the end of December 2014 versus € 2.634 billion in 2013. On a
currency-neutral basis, inventories decreased 1%, mainly as a result of the transfer of Rockport
inventories to assets classified as held for sale. Inventories from continuing operations decreased
1% (+2% currency-neutral), reflecting the Group’s focus on inventory management. Short-term
financial assets declined 88% to € 5 million at the end of December 2014 from € 41 million in 2013.
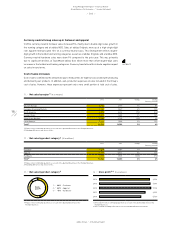
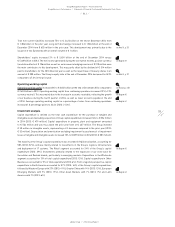
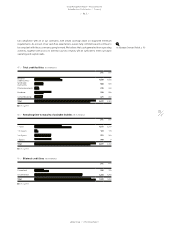
This development was driven by the decrease in short-term cash investments. Group receivables
increased 8% to € 1.946 billion at the end of December 2014 (2013: € 1.809 billion). On a currency-
neutral basis, receivables were up 2%. Receivables from continuing operations increased 10% (+5%
currency-neutral), reflecting the growth of our business during the fourth quarter of 2014. Other
current financial assets more than doubled to € 398 million at the end of December 2014 from
€ 183 million in 2013. This development was driven by an increase in the fair value of financial
see Diagram 35
see Note 09, p. 209
see Diagram 36
see Note 06, p. 207
see Note 07, p. 208
see Diagram 37
see Note 08, p. 208
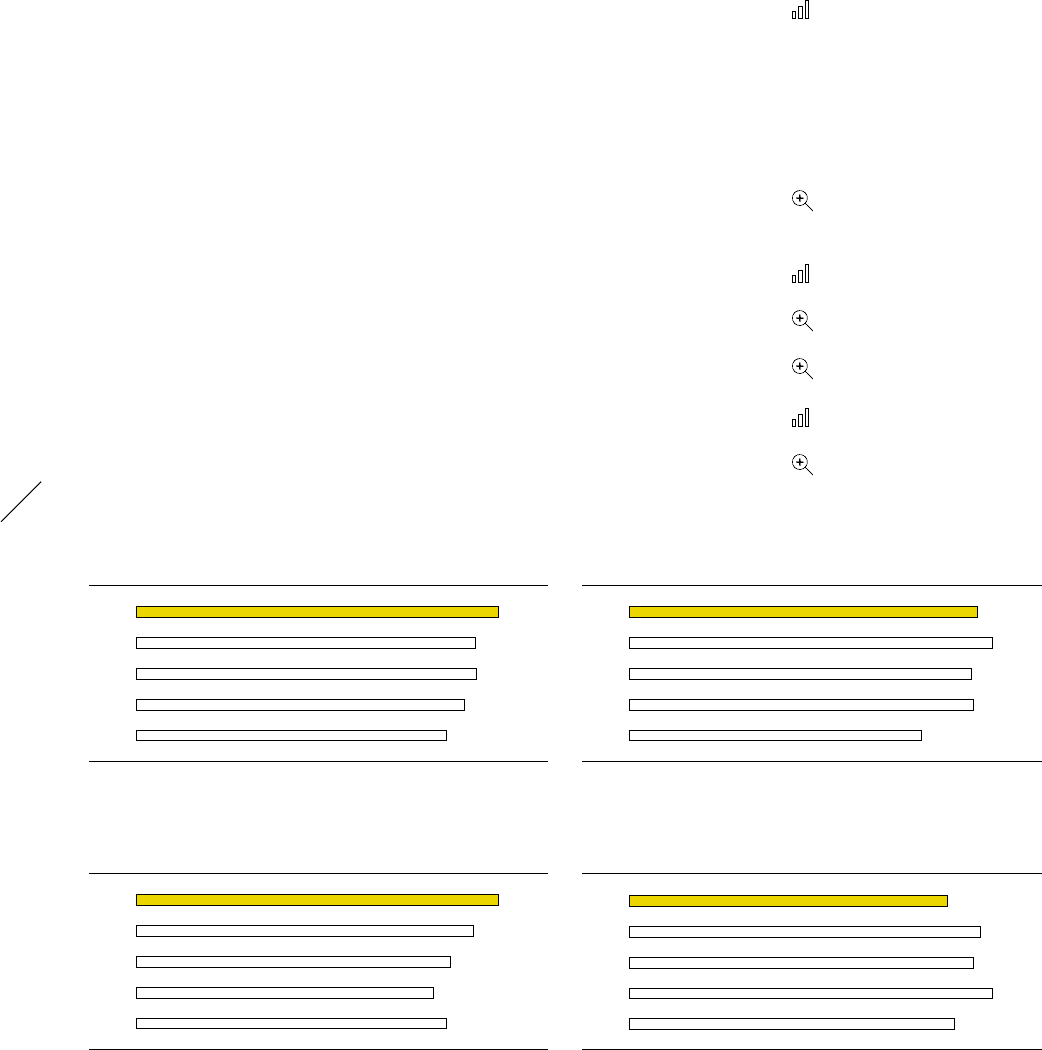
35
/
Total assets 1) (€ in millions)
2014 12,417
2013 11,599
2012 11,651
2011 11,237
2010 10,618
1) 2011 restated according to IAS 8 in the 2012 consolidated financial statements.
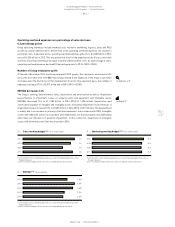
36
/
Inventories 1) (€ in millions)
2014 2,526
2013 2,634
2012 2,486
2011 2,502
2010 2,119
1) 2011 restated according to IAS 8 in the 2012 consolidated financial statements.
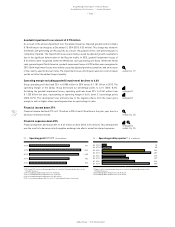
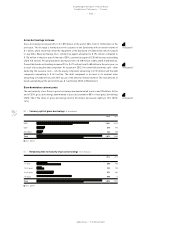
37
/
Accounts receivable 1) (€ in millions)
2014 1,946
2013 1,809
2012 1,688
2011 1,595
2010 1,667
1) 2011 restated according to IAS 8 in the 2012 consolidated financial statements.
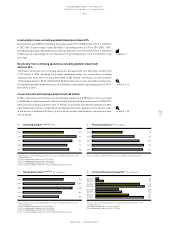
38
/
Accounts payable 1) (€ in millions)
2014 1,652
2013 1,825
2012 1,790
2011 1,887
2010 1,694
1) 2011 restated according to IAS 8 in the 2012 consolidated financial statements.