Reebok 2014 Annual Report Download - page 147
Download and view the complete annual report
Please find page 147 of the 2014 Reebok annual report below. You can navigate through the pages in the report by either clicking on the pages listed below, or by using the keyword search tool below to find specific information within the annual report.-
 1
1 -
 2
2 -
 3
3 -
 4
4 -
 5
5 -
 6
6 -
 7
7 -
 8
8 -
 9
9 -
 10
10 -
 11
11 -
 12
12 -
 13
13 -
 14
14 -
 15
15 -
 16
16 -
 17
17 -
 18
18 -
 19
19 -
 20
20 -
 21
21 -
 22
22 -
 23
23 -
 24
24 -
 25
25 -
 26
26 -
 27
27 -
 28
28 -
 29
29 -
 30
30 -
 31
31 -
 32
32 -
 33
33 -
 34
34 -
 35
35 -
 36
36 -
 37
37 -
 38
38 -
 39
39 -
 40
40 -
 41
41 -
 42
42 -
 43
43 -
 44
44 -
 45
45 -
 46
46 -
 47
47 -
 48
48 -
 49
49 -
 50
50 -
 51
51 -
 52
52 -
 53
53 -
 54
54 -
 55
55 -
 56
56 -
 57
57 -
 58
58 -
 59
59 -
 60
60 -
 61
61 -
 62
62 -
 63
63 -
 64
64 -
 65
65 -
 66
66 -
 67
67 -
 68
68 -
 69
69 -
 70
70 -
 71
71 -
 72
72 -
 73
73 -
 74
74 -
 75
75 -
 76
76 -
 77
77 -
 78
78 -
 79
79 -
 80
80 -
 81
81 -
 82
82 -
 83
83 -
 84
84 -
 85
85 -
 86
86 -
 87
87 -
 88
88 -
 89
89 -
 90
90 -
 91
91 -
 92
92 -
 93
93 -
 94
94 -
 95
95 -
 96
96 -
 97
97 -
 98
98 -
 99
99 -
 100
100 -
 101
101 -
 102
102 -
 103
103 -
 104
104 -
 105
105 -
 106
106 -
 107
107 -
 108
108 -
 109
109 -
 110
110 -
 111
111 -
 112
112 -
 113
113 -
 114
114 -
 115
115 -
 116
116 -
 117
117 -
 118
118 -
 119
119 -
 120
120 -
 121
121 -
 122
122 -
 123
123 -
 124
124 -
 125
125 -
 126
126 -
 127
127 -
 128
128 -
 129
129 -
 130
130 -
 131
131 -
 132
132 -
 133
133 -
 134
134 -
 135
135 -
 136
136 -
 137
137 -
 138
138 -
 139
139 -
 140
140 -
 141
141 -
 142
142 -
 143
143 -
 144
144 -
 145
145 -
 146
146 -
 147
147 -
 148
148 -
 149
149 -
 150
150 -
 151
151 -
 152
152 -
 153
153 -
 154
154 -
 155
155 -
 156
156 -
 157
157 -
 158
158 -
 159
159 -
 160
160 -
 161
161 -
 162
162 -
 163
163 -
 164
164 -
 165
165 -
 166
166 -
 167
167 -
 168
168 -
 169
169 -
 170
170 -
 171
171 -
 172
172 -
 173
173 -
 174
174 -
 175
175 -
 176
176 -
 177
177 -
 178
178 -
 179
179 -
 180
180 -
 181
181 -
 182
182 -
 183
183 -
 184
184 -
 185
185 -
 186
186 -
 187
187 -
 188
188 -
 189
189 -
 190
190 -
 191
191 -
 192
192 -
 193
193 -
 194
194 -
 195
195 -
 196
196 -
 197
197 -
 198
198 -
 199
199 -
 200
200 -
 201
201 -
 202
202 -
 203
203 -
 204
204 -
 205
205 -
 206
206 -
 207
207 -
 208
208 -
 209
209 -
 210
210 -
 211
211 -
 212
212 -
 213
213 -
 214
214 -
 215
215 -
 216
216 -
 217
217 -
 218
218 -
 219
219 -
 220
220 -
 221
221 -
 222
222 -
 223
223 -
 224
224 -
 225
225 -
 226
226 -
 227
227 -
 228
228 -
 229
229 -
 230
230 -
 231
231 -
 232
232 -
 233
233 -
 234
234 -
 235
235 -
 236
236 -
 237
237 -
 238
238 -
 239
239 -
 240
240 -
 241
241 -
 242
242 -
 243
243 -
 244
244 -
 245
245 -
 246
246 -
 247
247 -
 248
248 -
 249
249 -
 250
250 -
 251
251 -
 252
252 -
 253
253 -
 254
254 -
 255
255 -
 256
256 -
 257
257 -
 258
258 -
 259
259 -
 260
260 -
 261
261 -
 262
262 -
 263
263 -
 264
264 -
 265
265 -
 266
266 -
 267
267 -
 268
268
 |
 |
Group Management Report – Financial Review
143
2014
/
03.3
/
adidas Group
/
2014 Annual Report
Business Performance by Segment
/
Other Businesses Performance
Other Businesses Performance
Other Businesses full year results
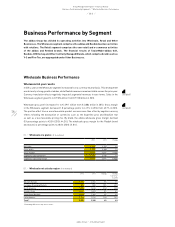
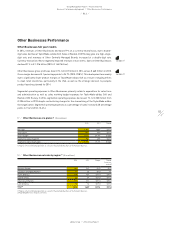
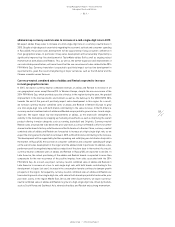
In 2014, revenues of Other Businesses decreased 19% on a currency-neutral basis, due to double-
digit sales declines at TaylorMade-adidas Golf. Sales at Reebok-CCM Hockey grew at a high-single-
digit rate, and revenues of Other Centrally Managed Brands increased at a double-digit rate.
Currency translation effects negatively impacted revenues in euro terms. Sales of Other Businesses
declined 21% to € 1.316 billion (2013: € 1.657 billion).
Other Businesses gross profit was down 31% to € 457 million in 2014 versus € 660 million in 2013.
Gross margin decreased 5.1 percentage points to 34.7% (2013: 39.8%). This development was mainly
due to significantly lower product margins at TaylorMade-adidas Golf as a result of ongoing efforts
to clean retail inventories, particularly in the USA, as well as the strategic decision to postpone
product launches planned for 2014.
Segmental operating expenses in Other Businesses primarily relate to expenditure for sales force
and administration as well as sales working budget expenses for TaylorMade-adidas Golf and
Reebok-CCM Hockey. In 2014, segmental operating expenses decreased 1% to € 203 million from
€ 205 million in 2013 despite restructuring charges for the streamlining of the TaylorMade-adidas
Golf organisation. Segmental operating expenses as a percentage of sales increased 3.0 percentage
points to 15.4% (2013: 12.4%).
see Table 17
see Table 17
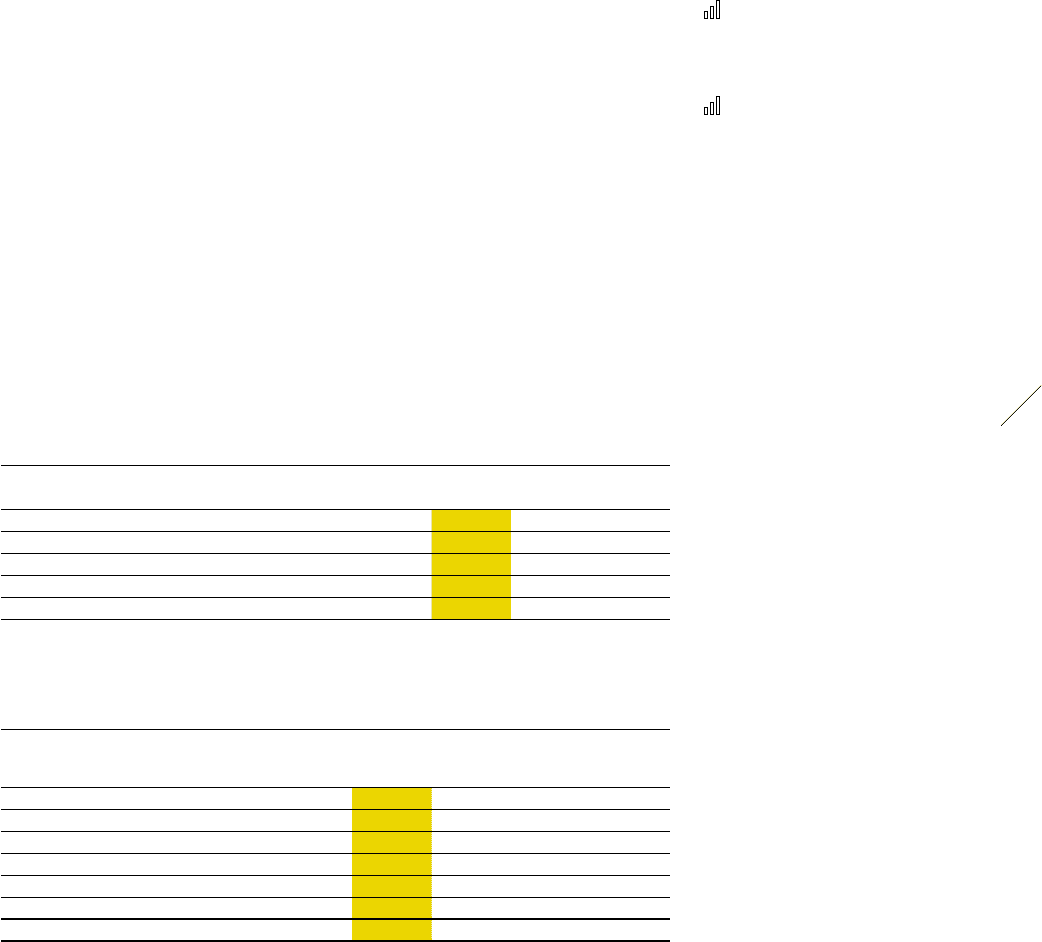
17
/
Other Businesses at a glance 1) (€ in millions)
2014 2013 Change
Net sales 1,316 1,657 (21%)
Gross profit 457 660 (31%)
Gross margin 34.7% 39.8% (5.1pp)
Segmental operating profit 254 455 (44%)
Segmental operating margin 19.3% 27.4% (8.1pp)
1) Figures reflect continuing operations as a result of the planned divestiture of the Rockport business.
18
/
Other Businesses net sales by region 1) (€ in millions)
2014 2013 Change Change
(currency-
neutral)
Western Europe 282 291 (3%) (5%)
European Emerging Markets 23 24 (5%) 7%
North America 755 931 (19%) (18%)
Greater China 25 36 (32%) (31%)
Other Asian Markets 221 361 (39%) (35%)
Latin America 10 14 (31%) (20%)
Total 2) 1,316 1,657 (21%) (19%)
1) Figures reflect continuing operations as a result of the planned divestiture of the Rockport business.
2) Rounding differences may arise in totals.
