Reebok 2014 Annual Report Download - page 130
Download and view the complete annual report
Please find page 130 of the 2014 Reebok annual report below. You can navigate through the pages in the report by either clicking on the pages listed below, or by using the keyword search tool below to find specific information within the annual report.-
 1
1 -
2
-
3
-
4
-
5
-
6
-
7
-
8
-
9
-
10
-
11
-
12
-
13
-
14
-
15
-
16
-
17
-
18
-
19
-
20
-
21
-
22
-
23
-
24
-
25
-
26
-
27
-
28
-
29
-
30
-
31
-
32
-
33
-
34
-
35
-
36
-
37
-
38
-
39
-
40
-
41
-
42
-
43
-
44
-
45
-
46
-
47
-
48
-
49
-
50
-
51
-
52
-
53
-
54
-
55
-
56
-
57
-
58
-
59
-
60
-
61
-
62
-
63
-
64
-
65
-
66
-
67
-
68
-
69
-
70
-
71
-
72
-
73
-
74
-
75
-
76
-
77
-
78
-
79
-
80
-
81
-
82
-
83
-
84
-
85
-
86
-
87
-
88
-
89
-
90
-
91
-
92
-
93
-
94
-
95
-
96
-
97
-
98
-
99
-
100
-
101
-
102
-
103
-
104
-
105
-
106
-
107
-
108
-
109
-
110
-
111
-
112
-
113
-
114
-
115
-
116
-
117
-
118
-
119
-
 120
120 -
 121
121 -
 122
122 -
 123
123 -
 124
124 -
 125
125 -
 126
126 -
 127
127 -
 128
128 -
 129
129 -
 130
130 -
 131
131 -
 132
132 -
 133
133 -
 134
134 -
 135
135 -
 136
136 -
 137
137 -
 138
138 -
 139
139 -
 140
140 -
141
-
142
-
143
-
144
-
145
-
146
-
147
-
148
-
149
-
150
-
151
-
152
-
153
-
154
-
155
-
156
-
157
-
158
-
159
-
160
-
161
-
162
-
163
-
164
-
165
-
166
-
167
-
168
-
169
-
170
-
171
-
172
-
173
-
174
-
175
-
176
-
177
-
178
-
179
-
180
-
181
-
182
-
183
-
184
-
185
-
186
-
187
-
188
-
189
-
190
-
191
-
192
-
193
-
194
-
195
-
196
-
197
-
198
-
199
-
200
-
201
-
202
-
203
-
204
-
205
-
206
-
207
-
208
-
209
-
210
-
211
-
212
-
213
-
214
-
215
-
216
-
217
-
218
-
219
-
220
-
221
-
222
-
223
-
224
-
225
-
226
-
227
-
228
-
229
-
230
-
231
-
232
-
233
-
234
-
235
-
236
-
237
-
238
-
239
-
240
-
241
-
242
-
243
-
244
-
245
-
246
-
247
-
248
-
249
-
250
-
251
-
252
-
253
-
254
-
255
-
256
-
257
-
258
-
259
-
260
-
261
-
262
-
263
-
264
-
265
-
266
-
267
-
268
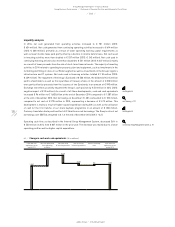
 |
 |
126
2014
/
03.2
/
adidas Group
/
2014 Annual Report
Group Management Report – Financial Review
Group Business Performance
/
Treasury
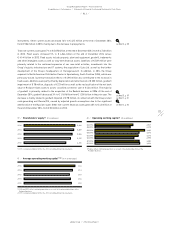
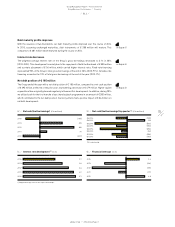
Effective currency management a key priority
As a globally operating company, the adidas Group is exposed to currency risks. Therefore, effective
currency management is a key focus of Group Treasury, with the aim of reducing the impact of
currency fluctuations on non-euro-denominated net future cash flows. In this regard, hedging US
dollars is a central part of our programme. This is a direct result of the Group’s Asian-dominated
sourcing, which is largely denominated in US dollars. In 2014, Group Treasury managed a net deficit
of around US $ 5.6 billion related to operational activities (2013: US $ 5.2 billion). Thereof, around
US $ 2.8 billion were against the euro (2013: US $ 2.6 billion). As governed by the Group’s Treasury
Policy, we have established a hedging system on a rolling basis up to 24 months in advance, under
which the vast majority of the anticipated seasonal hedging volume is secured approximately six
months prior to the start of a season. As a result, we have almost completed our anticipated hedging
needs for 2015 as of year-end 2014 and have already started hedging our exposure for 2016. In
2015, the positive effect from a more favourable EUR/USD conversion rate is expected to be more
than offset by less favourable conversion rates in emerging markets, especially Russia. The use
or combination of different hedging instruments, such as forward exchange contracts, currency
options and swaps, protects us against unfavourable currency movements. The use of currency
options allows the Group to benefit from future favourable exchange rate developments.
see Global Operations, p. 66
see Risk and Opportunity Report, p. 154
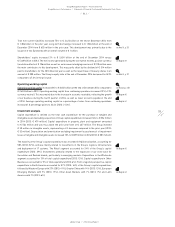
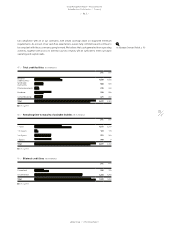
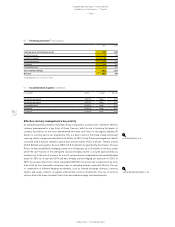
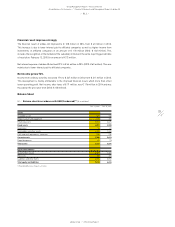
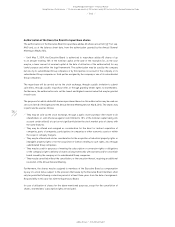
56
/
Financing structure 1) (€ in millions)
2014 2013
Cash and short-term financial assets 1,688 1,629
Bank borrowings 174 126
Commercial paper 20 0
Private placements 218 248
Eurobond 990 500
Convertible bond 471 460
Gross total borrowings 1,873 1,334
Net cash (185) 295
1) Rounding differences may arise in totals.
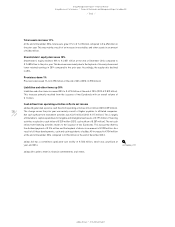
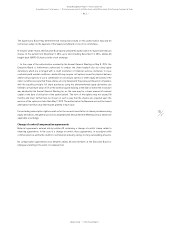
57
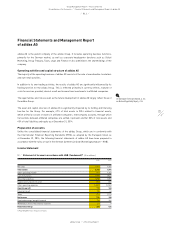
/
Issued bonds at a glance (in millions)
Issued bonds Volume Coupon Maturity
US private placement USD 115 fixed 2015
US private placement USD 150 fixed 2016
Convertible bond EUR 500 fixed 2019
Eurobond EUR 600 fixed 2021
Eurobond EUR 400 fixed 2026