Reebok 2014 Annual Report Download - page 119
Download and view the complete annual report
Please find page 119 of the 2014 Reebok annual report below. You can navigate through the pages in the report by either clicking on the pages listed below, or by using the keyword search tool below to find specific information within the annual report.-
 1
1 -
2
-
3
-
4
-
5
-
6
-
7
-
8
-
9
-
10
-
11
-
12
-
13
-
14
-
15
-
16
-
17
-
18
-
19
-
20
-
21
-
22
-
23
-
24
-
25
-
26
-
27
-
28
-
29
-
30
-
31
-
32
-
33
-
34
-
35
-
36
-
37
-
38
-
39
-
40
-
41
-
42
-
43
-
44
-
45
-
46
-
47
-
48
-
49
-
50
-
51
-
52
-
53
-
54
-
55
-
56
-
57
-
58
-
59
-
60
-
61
-
62
-
63
-
64
-
65
-
66
-
67
-
68
-
69
-
70
-
71
-
72
-
73
-
74
-
75
-
76
-
77
-
78
-
79
-
80
-
81
-
82
-
83
-
84
-
85
-
86
-
87
-
88
-
89
-
90
-
91
-
92
-
93
-
94
-
95
-
96
-
97
-
98
-
99
-
100
-
101
-
102
-
103
-
104
-
105
-
106
-
107
-
108
-
 109
109 -
 110
110 -
 111
111 -
 112
112 -
 113
113 -
 114
114 -
 115
115 -
 116
116 -
 117
117 -
 118
118 -
 119
119 -
 120
120 -
 121
121 -
 122
122 -
 123
123 -
 124
124 -
 125
125 -
 126
126 -
 127
127 -
 128
128 -
 129
129 -
130
-
131
-
132
-
133
-
134
-
135
-
136
-
137
-
138
-
139
-
140
-
141
-
142
-
143
-
144
-
145
-
146
-
147
-
148
-
149
-
150
-
151
-
152
-
153
-
154
-
155
-
156
-
157
-
158
-
159
-
160
-
161
-
162
-
163
-
164
-
165
-
166
-
167
-
168
-
169
-
170
-
171
-
172
-
173
-
174
-
175
-
176
-
177
-
178
-
179
-
180
-
181
-
182
-
183
-
184
-
185
-
186
-
187
-
188
-
189
-
190
-
191
-
192
-
193
-
194
-
195
-
196
-
197
-
198
-
199
-
200
-
201
-
202
-
203
-
204
-
205
-
206
-
207
-
208
-
209
-
210
-
211
-
212
-
213
-
214
-
215
-
216
-
217
-
218
-
219
-
220
-
221
-
222
-
223
-
224
-
225
-
226
-
227
-
228
-
229
-
230
-
231
-
232
-
233
-
234
-
235
-
236
-
237
-
238
-
239
-
240
-
241
-
242
-
243
-
244
-
245
-
246
-
247
-
248
-
249
-
250
-
251
-
252
-
253
-
254
-
255
-
256
-
257
-
258
-
259
-
260
-
261
-
262
-
263
-
264
-
265
-
266
-
267
-
268
 |
 |
Group Management Report – Financial Review
115
2014
/
03.2
/
adidas Group
/
2014 Annual Report
Group Business Performance
/
Statement of Financial Position and Statement of Cash Flows
Statement of Financial Position and
Statement of Cash Flows
Accounting policy
The Group’s consolidated financial statements are prepared in accordance with the International
Financial Reporting Standards (IFRS), as adopted by the EU. In 2014, new standards and
interpretations and amendments to existing standards and interpretations were applicable. The
changes mainly require additional disclosures in the Group’s financial statements.
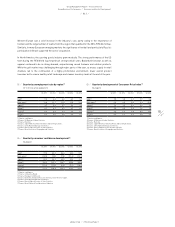
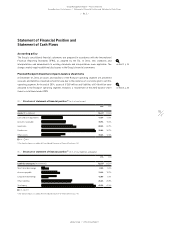
Planned Rockport divestiture impacts balance sheet items
At December 31, 2014, all assets and liabilities of the Rockport operating segment are presented
as assets and liabilities classified as held for sale due to the existence of a concrete plan to sell this
operating segment. At the end of 2014, assets of € 260 million and liabilities of € 46 million were
allocated to the Rockport operating segment. However, a restatement of the 2013 balance sheet
items is not allowed under IFRS.
see Note 01, p. 196
see Note 03, p. 206
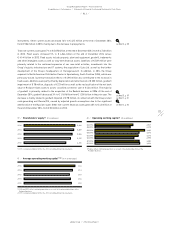
33
/
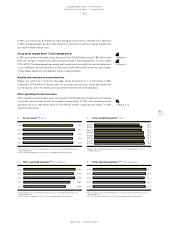
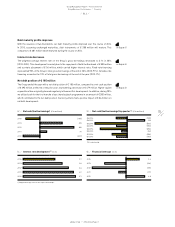
Structure of statement of financial position 1) (in % of total assets)
2014 2013
Assets (€ in millions) 12,417 11,599
Cash and cash equivalents 13.6% 13.7%
Accounts receivable 15.7% 15.6%
Inventories 20.3% 22.7%
Fixed assets 35.0% 35.7%
Other assets 15.4% 12.3%
■ 2014 ■ 2013
1) For absolute figures see adidas AG Consolidated Statement of Financial Position, p. 190.
34
/
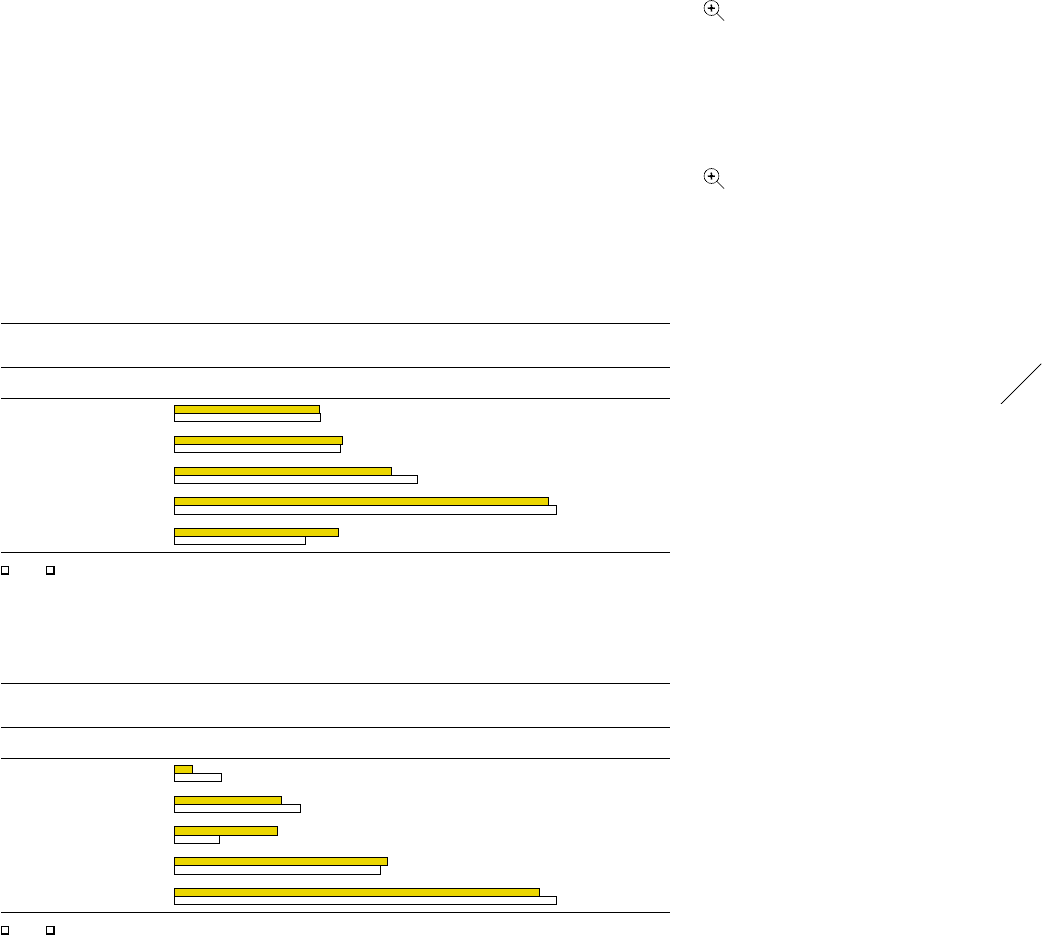
Structure of statement of financial position 1) (in % of total liabilities and equity)
2014 2013
Liabilities and equity (€ in millions) 12,417 11,599
Short-term borrowings 2.3% 5.9%
Accounts payable 13.3% 15.7%
Long-term borrowings 12.8% 5.6%
Other liabilities 26.4% 25.5%
Total equity 45.2% 47.3%
■ 2014 ■ 2013
1) For absolute figures see adidas AG Consolidated Statement of Financial Position, p. 190.